| TMemStat [message #11484] |
Wed, 09 February 2011 11:42 |
 StefanoSpataro
Messages: 2736
Registered: June 2005
Location: Torino
|
first-grade participant |

From: *to.infn.it
|
|
Dear all,
I am trying to investigate the memory usage of our code by using the new TMemStat tool from ROOT.
I have added to my sim macro the following line just at the beginning:
TMemStat mm("gnubuiltin");
and I have processed 10k DPM events.
First of all, I have seen our famous common error:
 **** GTRIGI: IEVENT=   2214 IDEVT=   2214 Random Seeds =       4357           0
-I FairPrimaryGenerator: 3 primary tracks from vertex (0, 0, 0)Event Time = 0(ns)
-I- PndStack: Filling MCTrack array...
-I- PndStack: Number of primaries        = 3
              Total number of particles  = 397
              Number of tracks in output = 138
Error: Symbol #include is not defined in current scope  run_sim_tpccombi_dpm.C:131:
Error: Symbol exception is not defined in current scope  run_sim_tpccombi_dpm.C:131:
Syntax Error: #include <exception> run_sim_tpccombi_dpm.C:131:
Error: Symbol G__exception is not defined in current scope  run_sim_tpccombi_dpm.C:131:
Error: type G__exception not defined FILE:/home/spataro/trunk/pandaroot/macro/pid/mtest/./run_sim_tpccombi_dpm.C LINE:131

 *** Break *** segmentation violation
-I- PndStack: Updating track indizes...Root > Function run_sim_tpccombi_dpm() busy flag cleared

 *** Break *** segmentation violation
and the macro has crashed.
After, if I have understood correctly, I open a new ROOT session and type:
spataro@briareos:~/trunk/pandaroot/macro/pid/mtest$ rt
root [0] TMemStat::Show()
Analyzing file: memstat_7796.root
Warning in <TFile::Init>: file memstat_7796.root probably not closed, trying to recover
Info in <TFile::Recover>: memstat_7796.root, recovered key TTree:T at address 332050543
Warning in <TFile::Init>: successfully recovered 1 keys
TMemStat::Show info: you are running on a machine with 4625 free MBytes of memory
TMemStatShow::Show will analyze only 947982432 bytes in its first pass
sel: ivmin=22982432, ivmax=947982432, nentries=28906250
==>The data Tree contains 10831340 entries with addresses in range[22982000,888605000]
root [1] .ls
TFile**		memstat_7796.root
 TFile*		memstat_7796.root
  OBJ: TTree	T	Memory Statistics : 0 at: 0x237dcc0
  OBJ: TH3F	htemp	pos:nbytes:time:btid {pos>2.29824e+07 && pos<9.47982e+08} : 1 at: 0x87fb5fb0
  OBJ: TH1D	h	memstat_7796.root : 0 at: 0x89e4c7d0
  OBJ: TH1D	fgHalloc	memstat_7796.root : 0 at: 0x89e4ccb0
  OBJ: TH1D	fgHfree	memstat_7796.root : 0 at: 0x89e4d290
  OBJ: TH1I	fgHdiff	 : 0 at: 0x89e4d860
  OBJ: TH1I	fgHentry	leak entry index : 0 at: 0x8873a1e0
  OBJ: TH1I	fgHleaks	leaks : 0 at: 0x8871c9d0
  OBJ: TH1I	htotleaks	main leaks sorted by btids : 0 at: 0x887913b0
  KEY: TTree	T;5	Memory Statistics
root [2]
Ok, the file has crashed then he needs to be recovered, no problems.
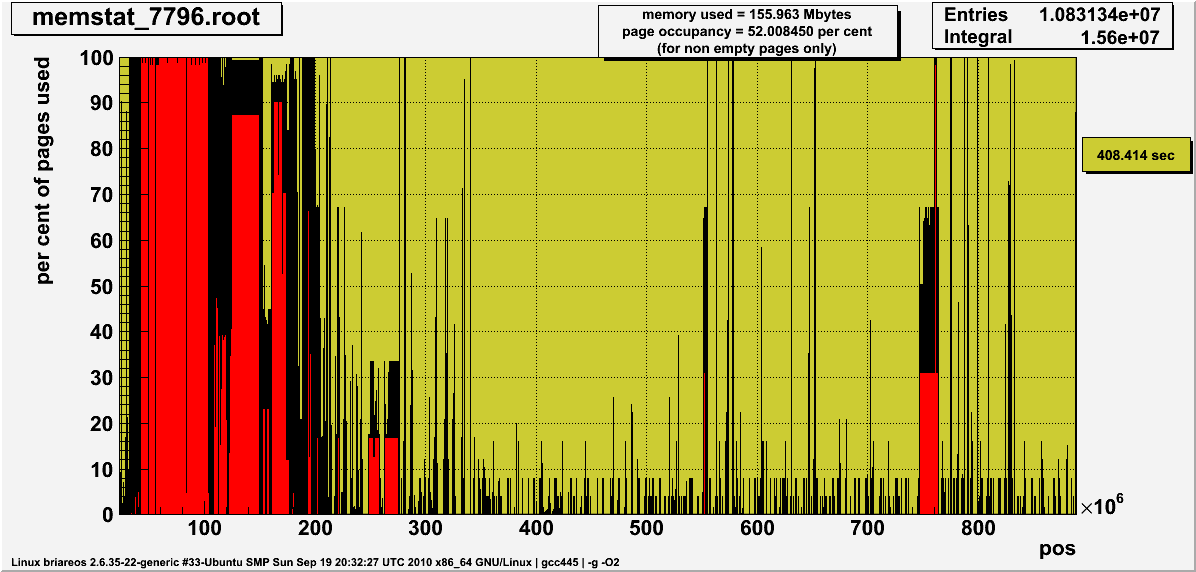
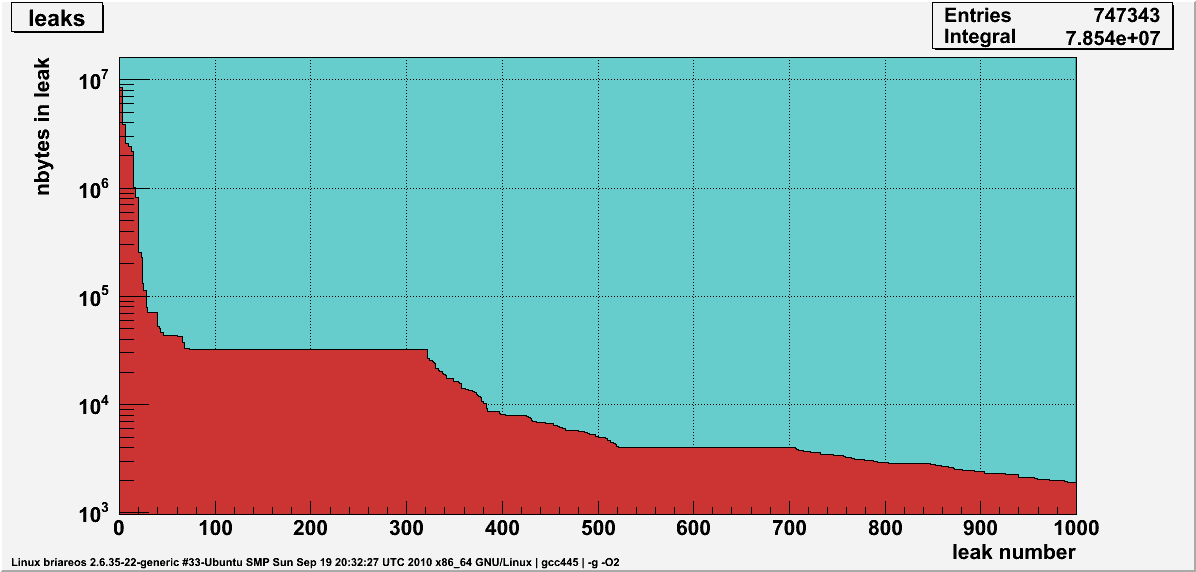
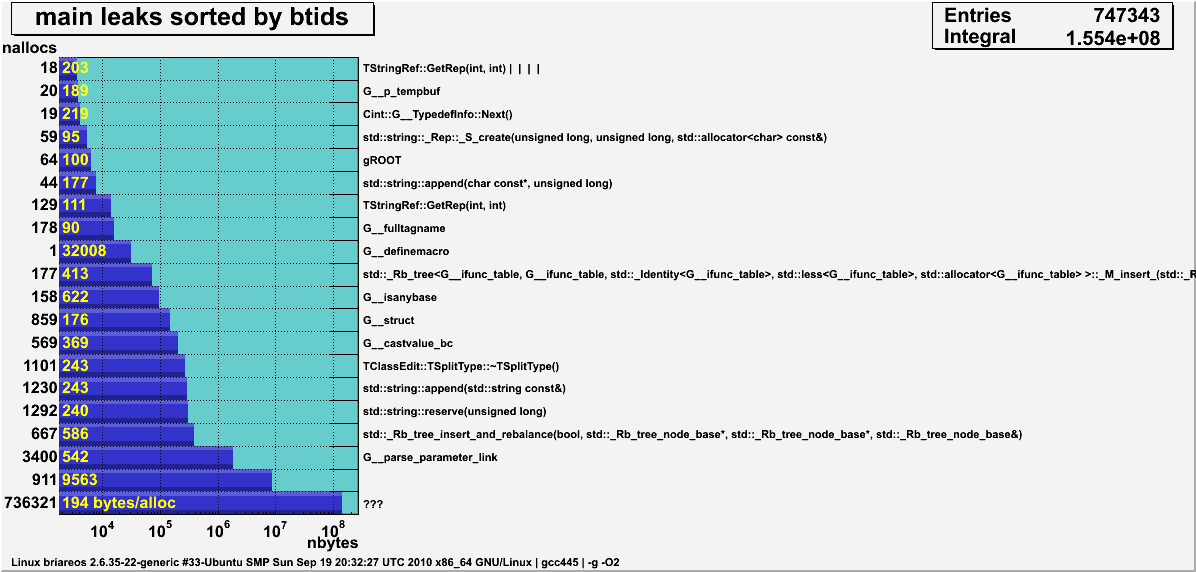
At the end I have three canvas:


I admit that I am not able to find in these plots what is going wrong. The file contains also a Tree which I can explore, but it does not tell me no many new informations.
Would the experts please suggest me what to plot and to show, in order to find what is making our simulation faulty?
Thanks in advance
-
 Attachment: fgC1.gif
(Size: 44.76KB, Downloaded 991 times)
-
 Attachment: fgC2.gif
(Size: 15.07KB, Downloaded 1018 times)
-
 Attachment: fgC3.gif
(Size: 29.47KB, Downloaded 921 times)
|
|
|
|
 GSI Forum