Hi all,
I know everyone likes his/her own style of plots. But anyway I'll share my stuff: In pandaroot/macro/mvd/Tools.C you will find a few helpful functions. Especially I'd like to point out that we had two frameworks ago a common root styleset for panda which the collaboration agreed on. I reanimated this one but could not resist to make some few changes to suit my taste.
To use it in a macro do:
  gROOT->LoadMacro(" ... mvd/Tools.C");
  LoadPandaStyle();
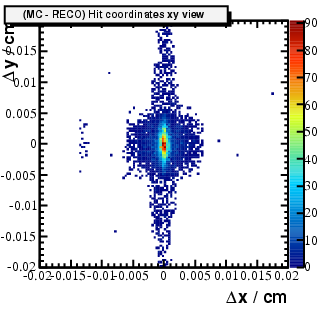
To have nice 2d histograms with a smooth palette use
DrawNice2DHisto(hisxy);
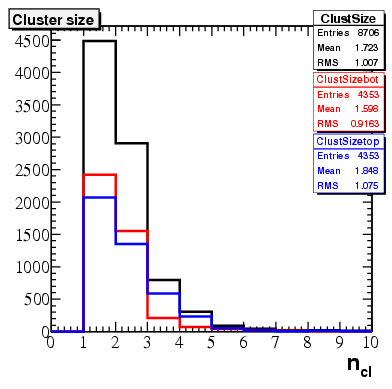
And finally for multiple Histograms in one plot (picture below)
  hisClustSize->Draw();
  hisClustSizeBot->SetLineColor(kRed);
  hisClustSizeTop->SetLineColor(kBlue);
  hisClustSizeBot->Draw("sames");
  hisClustSizeTop->Draw("sames");
  can7->Update();
  TPad* mypad=(TPad*)gPad;
  BetterStatBox(mypad);
Feel free to contribute.
Greetings from Dresden, Ralf.
[Updated on: Fri, 25 July 2008 13:33]
Report message to a moderator
 GSI Forum