GSI Forum
GSI Helmholtzzentrum für Schwerionenforschung

Home » NUSTAR » NUSTAR PRESPEC » prespec data analysis package
prespec data analysis package [message #16977] Thu, 10 July 2014 13:02 Go to next message
thuyuk is currently offline  thuyuk
Messages: 68
Registered: July 2014
continuous participant

From: *ific.uv.es
Hi everyone,

Before to start my question, I should say that I'm using the configuration files from Michael.

My problem is related to the mapping of the ParticleGammaTime of Agata/Adapter processor in Agata.config file. The part of the config file I mentioned is like this in the original file provided by Michael:

particle_gamma_time[36] <- Agata/ParticleGammaTime.output[0]
particle_gamma_time[37] <- Agata/ParticleGammaTime.output[1]
particle_gamma_time[38] <- Agata/ParticleGammaTime.output[2]
particle_gamma_time[13] <- Agata/ParticleGammaTime.output[3]
particle_gamma_time[14] <- Agata/ParticleGammaTime.output[4]
particle_gamma_time[39] <- Agata/ParticleGammaTime.output[5]
particle_gamma_time[40] <- Agata/ParticleGammaTime.output[6]
particle_gamma_time[41] <- Agata/ParticleGammaTime.output[7]
particle_gamma_time[42] <- Agata/ParticleGammaTime.output[8]
particle_gamma_time[43] <- Agata/ParticleGammaTime.output[9]
particle_gamma_time[44] <- Agata/ParticleGammaTime.output[10]
particle_gamma_time[04] <- Agata/ParticleGammaTime.output[11]
particle_gamma_time[05] <- Agata/ParticleGammaTime.output[12]
particle_gamma_time[18] <- Agata/ParticleGammaTime.output[13]
particle_gamma_time[19] <- Agata/ParticleGammaTime.output[16]
particle_gamma_time[01] <- Agata/ParticleGammaTime.output[21]
particle_gamma_time[13] <- Agata/ParticleGammaTime.output[22]

I'm a little bit confused, because we had 19 crystals working during the commissioning runs and the experiments done in the 3rd quarter of 2012. But, here, there are 17 of MH TDC channels are addressed to the input array particle_gamma_time. Also, it is not clear for me to understand, why, e.g., Agata/ParticleGammaTime.output[22] corresponds to particle_gamma_time[13]?

The original config file used to fill Agata/ParticleGammaTime.output array from the crate AgataTimeCrate, but in my case this crate is empty, and AgataTimeCrate2 has channels with the data. So, I set the config file to get the data from AgataTimeCrate2. But, the same confusion arose here, how could one know which member of ParticleGammaTime.output array corresponds to which member of particle_gamma_time input array? Because in case of AgataTimeCrate2, the occupied MH TDC channels are like this:

Agata/ParticleGammaTime.output[0]
Agata/ParticleGammaTime.output[1]
Agata/ParticleGammaTime.output[2]
Agata/ParticleGammaTime.output[3]
Agata/ParticleGammaTime.output[5]
Agata/ParticleGammaTime.output[6]
Agata/ParticleGammaTime.output[7]
Agata/ParticleGammaTime.output[8]
Agata/ParticleGammaTime.output[10]
Agata/ParticleGammaTime.output[16]
Agata/ParticleGammaTime.output[17]
Agata/ParticleGammaTime.output[18]
Agata/ParticleGammaTime.output[19]
Agata/ParticleGammaTime.output[20]
Agata/ParticleGammaTime.output[21]
Agata/ParticleGammaTime.output[22]
Agata/ParticleGammaTime.output[23]
Agata/ParticleGammaTime.output[24]
Agata/ParticleGammaTime.output[26]

Thanks a lot in advance for your help!
Tayfun
Re: prespec data analysis package [message #16980 is a reply to message #16977] Thu, 10 July 2014 18:49 Go to previous messageGo to next message
miree is currently offline  miree
Messages: 71
Registered: June 2014
continuous participant
From: *ikp.physik.tu-darmstadt.de
Hi Tayfun,

I think you got an old version of the AgataTimeCrate configuration.
Try to put only one time crate for AGATA like this:

crate AgataTimeCrate
procid 86
triggers all
module mhtdc LYCCA.v1290TMM triggers 2 3 5 6 7 8 9 10
module scaler LYCCA.v830 triggers 1 12 13
end

This contains a scaler and a multihit TDC that are read out on different triggers.


Assignments like "particle_gamma_time[36] <- Agata/ParticleGammaTime.output[0]" describe the mapping from the multihit TDC channel to the crystal-ID that provides the signals for the TDC channel. In this example, AGATA crystal 36 (=12A) was plugged (via a CFD) into channel 0 of the multihit TDC. How to find this assignment is described below.
The reason why you have 17 only, is that you based your analysis on the files for the performance commissioning. There were only 17 crystals in the setup. You need to find the two missing assignments (and verify the 17 assignments that are already there).


Another method to get the particle-gamma time is by using the following quantities:
a) time information inside the PSA frames (T0 and/or T1): This gives the difference between the GST timestamp of that PSA frame and the rising edge of the core signal.
b) the time difference between the Sc41 signal and the AGAVA accepted signal - both measured in one multihit TDC in the user crate.
c) the difference between the GTS timestamp of the MBS event and the GTS timestamp of the PSA frame.

The AgataAdapter processor computes from these quantities the particle-gamma time difference and provides it in the output arrays "core_pgtime_high" (using the T0 field in the PSA frame) and "core_pgtime_low" (using the T1 field in the PSA frame).
In order to do this, it needs the GTS timestamp from the AGAVA module
timestamp_agava_high24 <- TrloCrate.agava[1]
timestamp_agava_low24 <- TrloCrate.agava[2]
and the time difference (b), coming from a multihit TDC
dt_sc41_agava_acc <- Agata/Sc41Time.output[0]

The core_pgtime_high and core_pgtime_low arrays contain the information for all crystals. You can use this information to find which core signal was plugged into which multihit TDC channel by plotting all combinations of crystal-ID and multihit-TDC channel. For example with the following loop:

for $ch in [0:27]
for $id in [0:179]
processor Agata/Lut_Finder_$ch_$id UTILS.DoubleArray
x[0] <- Agata/ParticleGammaTime.output[$ch]
y[0] <- Agata/Adapter.core_pgtime_low[$id]
display x:y in Lut_Finder_$ch
end
end
end

Now, look for the plots that show the correct correlation between both quantities. If the combination of crystal-ID/multihit-channel is correct, you should get a plot similar to the one "TimeTime_good.png" (attached). For all wrong combination, the plot looks similar to "TimeTime_bad1.png".

Best regards,
Michael

Re: prespec data analysis package [message #16989 is a reply to message #16980] Fri, 11 July 2014 12:02 Go to previous messageGo to next message
thuyuk is currently offline  thuyuk
Messages: 68
Registered: July 2014
continuous participant

From: *ific.uv.es
Hi Michael,

Thank you very much for the detailed explanation of timing in AgataAdapter.

Cheers,
Tayfun
Re: prespec data analysis package [message #16990 is a reply to message #16989] Fri, 11 July 2014 13:17 Go to previous messageGo to next message
thuyuk is currently offline  thuyuk
Messages: 68
Registered: July 2014
continuous participant

From: *ific.uv.es
Hi Michael,

May I ask you to check AgataTimeCrate if you have missed something. Because, what you suggested doesn't work as it is.

Thank you,
Tayfun


edit:
sorry, it was my mistake. I was not able to see the error messages on Go4's terminal window as it moves rather fast. it was not related to the crate. it works now!

[Updated on: Fri, 11 July 2014 13:23]

Report message to a moderator

Re: prespec data analysis package [message #16999 is a reply to message #16989] Mon, 14 July 2014 09:34 Go to previous messageGo to next message
thuyuk is currently offline  thuyuk
Messages: 68
Registered: July 2014
continuous participant

From: *ific.uv.es
Hi Michael,

I'm having trouble to get the proper 2d histograms of mhtdc_time vs. psa_time correlations.

I get them as the attached images for ch=0 (19 of them and zoomed in to one of them).

I cannot reproduce a similar correlation plots like you do.
What does the reference signal of the mhtdc look like in your case?
Re: prespec data analysis package [message #17003 is a reply to message #16999] Mon, 14 July 2014 15:37 Go to previous messageGo to next message
miree is currently offline  miree
Messages: 71
Registered: June 2014
continuous participant
From: *ikp.physik.tu-darmstadt.de
Hi,

Typically the histogram with most counts is the correct one, because the others are only filled with random coincidences.
As far as I can see, most counts are in the top-left histogram (channel=0 crystal-id=004) in "agata_pgt_corr_all.png".
Can you choose a different binning, for example 500,0,300:500,600,1000 or even more centered around the spot in the middle 500,100,150:500,800,900? I think you'll be able to see the corellation there.

Michael
Re: prespec data analysis package [message #17010 is a reply to message #17003] Mon, 14 July 2014 17:00 Go to previous messageGo to next message
thuyuk is currently offline  thuyuk
Messages: 68
Registered: July 2014
continuous participant

From: *ific.uv.es
Hi Michael,

thank you for your answer.

But, it doesn't seem to me that the correlation will be more distinguishable when we zoomed in to the area you pointed out. Anyway, I did what you said, and here is the result for the one that you interpreted as there might be the correlation:

zoomed in:
index.php?t=getfile&id=7951&private=0

a little bit zoomed out:
index.php?t=getfile&id=7952&private=0

Is this a sign of a something that is wrong? I'm keeping try to understand why they are not correlated.

Thanks for your help,
tayfun

Re: prespec data analysis package [message #17019 is a reply to message #16977] Tue, 15 July 2014 13:37 Go to previous messageGo to next message
miree is currently offline  miree
Messages: 71
Registered: June 2014
continuous participant
From: *gsi.de
I believe that this is the correct combination of crystal-id and TDC channel. But it doesn't look right yet. However, it doesn't look completely wrong. I have marked in red the uncorrelated events and in green the ones that seem to look OK. You have somehow good and bad events in the histogram.
index.php?t=getfile&id=7953&private=0

All of the relevant timing measurements in this part of the experiment are done with CAENv1290 multihit TDCs. "multihit" means, that every channel can contain multiple time measurements. You have to select (by putting an appropriate gate) the right hits from each channel.

This is done by setting a gate for each multihit-tdc channel. For example you have to set the gate of the processor "Agata/Sc41Time" to cover the peak that you see in the spectrum:
index.php?t=getfile&id=7954&private=0

The same has to be done with all the gates in the processor "Agata/ParticleGammaTime".

If you adjusted all the gates, you should see in one of the psa-time vs multihit-time a clear correlation (that is similar to the green part in the first picture, if you zoom in)
Re: prespec data analysis package [message #17066 is a reply to message #17019] Sat, 19 July 2014 16:43 Go to previous messageGo to next message
thuyuk is currently offline  thuyuk
Messages: 68
Registered: July 2014
continuous participant

From: 84.79.220*
Hi Michael,

Thanks for the tips you gave.

I have already set the condition windows on the MHTDC channels before and went through again after your message, and they seem all fine.

I still don't understand why I cannot see a proper time correlation between the one from the MHTDC and the one from the PSA frames. They look like the follwoing images for all crystals:

index.php?t=getfile&id=7973&private=0

so the upper spectrum is the one from the psa frame and the other is from the MHTDC.

The FWHM of the prompt peak is around 14ns and the delayed component has a resolution of ~50 ns in case of the time information from the psa frame. The central sharp peak on the MHTDC spectrum has a 12 ns resolution. The structure on the both sides of this peak is not understood. They are due to the delayed-like components from each crystal, but also it is not understood why these components are on the left hand side for some of the crystals and why they are on the right side for the others.

May I ask you which time information do you use to put a time condition in order to supress the background in your analysis?

Thanks!
tayfun
Re: AGATA particle-gamma time [message #17081 is a reply to message #17066] Tue, 22 July 2014 10:13 Go to previous messageGo to next message
miree is currently offline  miree
Messages: 71
Registered: June 2014
continuous participant
From: *gsi.de
If all the MHTDC gates are good and you do not find any pair of (MHTDC-channel, crystal-ID) that shows a correlated time... then it looks like there was something wrong. It might be that something is wrong during ADF-MBS merging. In the directory, where you do the replay, there should be a file called "timestampdifference.dat" that shows a histogram of the GTS-timestamp difference between MBS and ADF part of the data. (It is an ascii file and you have to plot it). Can you post this file here? There should be one peak inside. If not, you can try to make the time window during merging. The default value for this is 3 microseconds, which should be enough.

The strange structure around the peak of the "particle_gamma_time" histogram (the one created by the MHTDC measurement) can be because the MHTDC channels are not aligned. You can align them by putting the correct number in the AgataAdapter.cal They are called "particle_gamma_time_alignment[0]" and you can try to change the offset (slope is always 1).
The AgataAdapter provides a way to determine the offsets:
1) add in your config file in the AgataAdapter processor the line
display  time_alignment_energy | time_alignment_energy_gate

and move the gate to cover an energy range from approx. 500 keV to a few MeV (below the saturation signatures called "bumps").
2) add in your config file in the AgataAdapter
display         gated_particle_gamma_time

This will create time spectra corresponding to the energy gate determined above. These time spectra will thus not be affected by low energy walk effects or high energy saturation effects.
In these spectra you can determine the center of the peaks and put this position with a minus sign into the .cal file of the adapter.
That should align the time histograms.
Re: AGATA particle-gamma time [message #17082 is a reply to message #17081] Tue, 22 July 2014 10:56 Go to previous messageGo to next message
thuyuk is currently offline  thuyuk
Messages: 68
Registered: July 2014
continuous participant

From: *ific.uv.es
Hi Michael,

Thank you very much for the detailed description.

This is how the timedifference.dat peak looks like:
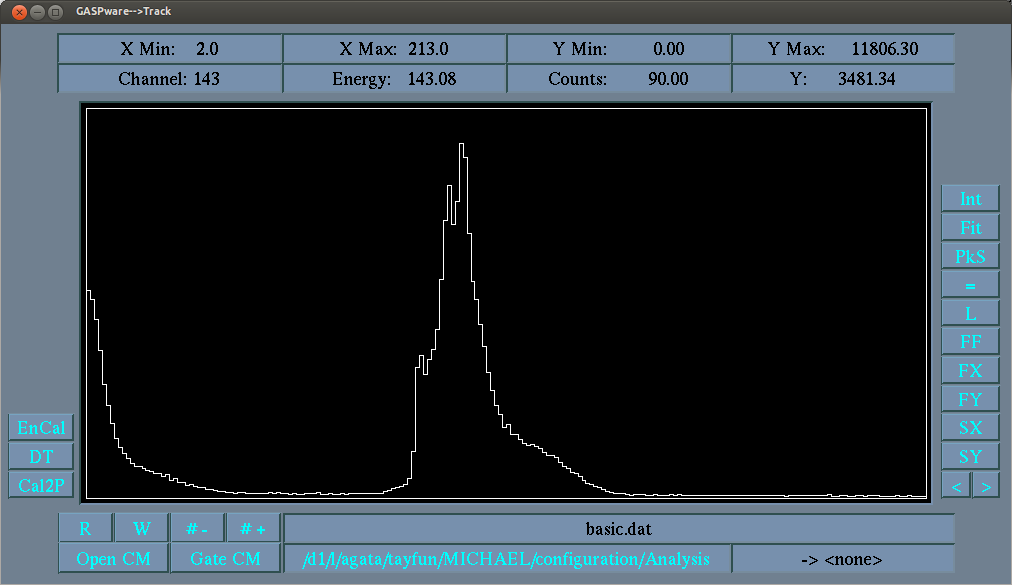
index.php?t=getfile&id=7980&private=0

Regarding to the particle-gamma time from the MHTDC, I already aligned them for each crystal by setting the offset, and they look like this:
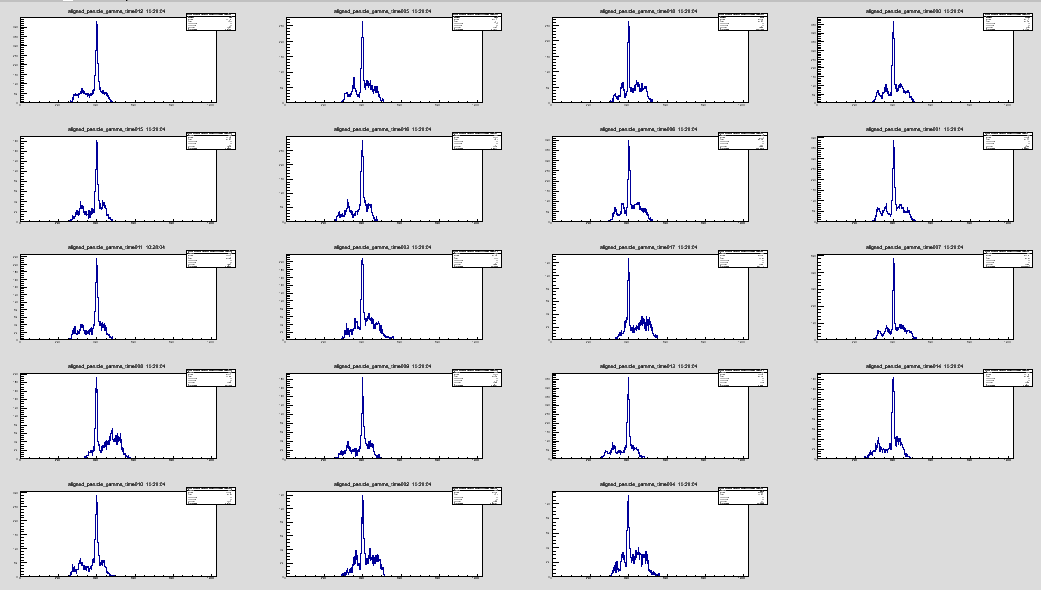
index.php?t=getfile&id=7979&private=0

So, I'm sorry if I was not being clear in my previous mail, but the strange structure is due to the contribution from each crystal, i.e. in some cases the peak is on the left hand side of the distribution and in the others on the right hand side. The superposition of the spectra from 19 crystals produces the spectrum that I have put in my previous post.

The lines you suggested me were already in the config file, and the energy gate was set to: 565 - 3000. It's 3 times wider than you have suggested but it is still below the saturation bump and above the low energy region.

Cheers,
Tayfun

[Updated on: Tue, 22 July 2014 10:59]

Report message to a moderator

Re: prespec data analysis package [message #17091 is a reply to message #16977] Wed, 23 July 2014 10:37 Go to previous messageGo to next message
miree is currently offline  miree
Messages: 71
Registered: June 2014
continuous participant
From: *gsi.de
Hi,
I've never seen this type of background around the peak in a MHTDC spectrum... I cannot say what is causing it.

The timestamp difference histogram looks good, exept that I've never seen this structure close to 0. Did you have the target in the forward (high intensity) position?

Perhaps you can make a trigger selection when looking at the spectra. How does the histograms look with a particle trigger?

You can add the line
 triggers 9 10 

inside any processor and it will only process data and display histograms for events with trigger 9 or trigger 10.
Re: AGATA particle-gamma time [message #17105 is a reply to message #17082] Fri, 25 July 2014 16:58 Go to previous messageGo to next message
miree is currently offline  miree
Messages: 71
Registered: June 2014
continuous participant
From: *088.069.pools.vodafone-ip.de
Hi,
how do the MHTDC raw spectra look like?
Michael
Re: AGATA particle-gamma time [message #17120 is a reply to message #17105] Mon, 28 July 2014 10:34 Go to previous messageGo to next message
thuyuk is currently offline  thuyuk
Messages: 68
Registered: July 2014
continuous participant

From: *ific.uv.es
Hi Michael,

Please find the raw MH TDC spectra in the attachment.

I will try what you suggested regarding to put trigger condition and observe the MH TDC spectra, write here soon the result.

cheers,
tayfun
  • Attachment: mhtdc_raw.png
    (Size: 36.35KB, Downloaded 305 times)
Re: AGATA particle-gamma time [message #17278 is a reply to message #17120] Thu, 11 September 2014 15:54 Go to previous messageGo to next message
thuyuk is currently offline  thuyuk
Messages: 68
Registered: July 2014
continuous participant

From: *ific.uv.es
Hi Michael,

The trigger condition didn't make any difference.

On the other hand, I'm trying to put a condition on the particle-gamma time to select the "coul-ex peaks". I'm using the time from the MHTDC. You may see E_g vs MHTDC 2D spectrum below:

index.php?t=getfile&id=8062&private=0

The energy is without Doppler correction.

What I don't understand is that we suppose to have the BG peaks equally distributed, but as you can see in the picture that they are concentrated on the p-g time prompt peak, which also makes life more difficult to clear the gamma spectrum. So, why do we have them concentrated in there while we suppose to get them distributed, and why are they found between 250 to 400 region but not in the opposite part?

Thank you!
Tayfun
  • Attachment: pg-mhtdc.png
    (Size: 59.84KB, Downloaded 510 times)
Re: AGATA particle-gamma time [message #17283 is a reply to message #17278] Fri, 12 September 2014 11:50 Go to previous messageGo to next message
miree is currently offline  miree
Messages: 71
Registered: June 2014
continuous participant
From: *ikp.physik.tu-darmstadt.de
Hi Tayfun,

I have the following thoughts when I see this spectrum:

It seems that you have a correlation between energy and time.

My first impression regarding the asymmetric lines is, that they are supposed be on top (and not below) the "prompt flash" (i.e. the long horizontal line, indicating the particle impact). Maybe your time axis is reversed (i.e. later times are smaller numbers).

Second impression: Is one of the lines the 1461 keV 40K line? That would have to be perfectly symmetric, indeed! But I also think this should be much weaker. Perhaps you have some beam-induced background line that is at the same energy.

You seem to have very little neutron induced Ge(n,n' gamma)Ge background lines.
These are typically at energies: 585 keV, 563 keV, 595 keV, 689 keV, 1039 keV, 1368 keV
Your beam was 58Ni, and your projectile was 52Fe. It seems that more neturons come with heavier beams.

Perhaps you can make a time-gate before the promt flash [430 to 550] and try to identify the common Background lines (at least the 1461keV 40K should be there) in the projection.

Another question: What was your S4 particle rate (ions/sec)? Perhaps the strange-looking MH-TDC raw spectra are just showing additional particles in your event. You can also check the multiplicity in your MH-TDC modules (in particular the Sci41 multiplicity). Perhaps you have lots of events with two or more particles?


Best regards,
Michael
Re: AGATA particle-gamma time [message #17284 is a reply to message #17283] Fri, 12 September 2014 12:08 Go to previous messageGo to next message
thuyuk is currently offline  thuyuk
Messages: 68
Registered: July 2014
continuous participant

From: *ific.uv.es
Hi Michael,

Thanks for the comments.

yes, that is the potassium line. But, what we don't understand is why this line (and some others also) are not distributed in time, why they are coming as their most intense in the flash peak?

The counting ratio was around 100k - 105k per spill at Sc41. We had 3 sec spills in 5 sec periods. This means that we had 35k per sec, roughly.

to be honest, I don't know whether the time scale is reversed, because I don't know how were the start and stop signals plugged in.

I forgot to mention you that this plot has already a condition on the MHTDC multiplicity = 1 condition on the Sc41. This we have put because we were suffering due to the pile-up in the MUSICs and things became better with the multiplicity condition.

Thank you!
Tayfun
Re: AGATA particle-gamma time [message #17296 is a reply to message #17284] Tue, 16 September 2014 11:41 Go to previous messageGo to next message
miree is currently offline  miree
Messages: 71
Registered: June 2014
continuous participant
From: *ikp.physik.tu-darmstadt.de
Hi Tayfun

A rate of 35k per second is quite high. The high rate might also be the reason for your strange-looking MH-TDC raw spectra that you showed before.

About the potassium line: That should be equally high before and after the particle impact... At the moment I have no idea what can cause this asymmetry...

Best regards,
Michael


Re: prespec data analysis package [message #17298 is a reply to message #16977] Tue, 16 September 2014 15:18 Go to previous message
Damian Ralet
Messages: 35
Registered: July 2014
Location: Darmstadt
continuous participant
From: *dynamic.qsc.de
Hi Tayfun,

Did you look at the time spectra with a trigger condition? For example, with a trigger 3, the background should be more dominent (Potassium, Cobalt, LaBr,...) and I would expect it uniformly distributed. I think, that the time structure will also take more understandable look with a trigger 9 (particle + gamma + lycca).

Cheers,
Damian
Previous Topic: Disagreement between the LISE++ calculations and the experiment
Next Topic: Logbooks and runsheets scan
Goto Forum:


Current Time: Thu Dec 12 21:45:03 CET 2024

Total time taken to generate the page: 0.00960 seconds