Home » Hades » Pluto » [SOLVED] Beam Smear and Cross Sections
| [SOLVED] Beam Smear and Cross Sections [message #13812] |
Tue, 24 July 2012 21:20  |
 Michael Kunkel
Messages: 53
Registered: June 2011
|
continuous participant |
From: 129.57.115*
|
|
Hello again,
Another question about beam smearing.
When I apply a beam smear of a reaction, does pluto preserve the production cross section for that specific beam energy?
I have investigated the output of the code below, and it seems the answer is no. So I ask the forum in case I am coding incorrectly.
    double ebeam_min = 1.1725;
    double ebeam_max = 5.44575;
    PBeamSmearing *beam_smear = new PBeamSmearing("beam_smear", "Beam smearing");


    TF1* beam_smear_fn = new TF1("beam_smear_fn", "1./x", ebeam_min, ebeam_max);

    beam_smear->SetReaction("g + p");
    beam_smear->SetMomentumFunction(beam_smear_fn);
    makeDistributionManager()->Add(beam_smear);

    ((PDalitzDecay * )makeDistributionManager()->GetDistribution("eta_dalitz"))->SetUseQED(1);


    PReaction my_reaction("_P1 = 2.2","g","p","p eta [dilepton [e+ e-] g]",creater,1,0,0,0);
Thanks
Michael
[Updated on: Tue, 28 May 2013 18:39] Report message to a moderator |
|
|
|
| Re: Bear Smear and Cross Sections [message #13833 is a reply to message #13812] |
Wed, 01 August 2012 12:45   |
 Ingo Froehlich
Messages: 167
Registered: March 2004
Location: IKF - Frankfurt
|
first-grade participant |
From: *x-matter.uni-frankfurt.de
|
|
No, there is no cross section included by default. What can be done is to add a weighting factor depending on the c.m. energy.
I have done such things in the elementary plugin for the p+N reactions
This can be done also in a macro, but one has to use makeDistributionManager() instead of the util class, i.e.
makeDistributionManager()->Add(....);
--
Ingo Froehlich
IKF - University of Frankfurt
069-798-47027, FAX: -47024
|
|
|
|
|
|
| Re: Bear Smear and Cross Sections [message #13848 is a reply to message #13836] |
Mon, 06 August 2012 20:26   |
 Michael Kunkel
Messages: 53
Registered: June 2011
|
continuous participant |
From: 129.57.112*
|
|
So unfortunately, the best cross section available data available for g p -> p eta was done in bins of cos(theta) c.m.
and the elementary plugin appears to be done in total cross section.
Would it be possible to have a plugin available in which the user can input the differential cross section data, and have PLUTO work with that?
i.e.
B_min    B_Max   W_min  W_max    x_min   x_max   x_mean  y_min  y_max    y_mean
1.03491	1.05287	1.68	1.69	-0.85	-0.9	-0.8	0.1899	0.1464	0.2334
1.03491	1.05287	1.68	1.69	-0.75	-0.8	-0.7	0.2513	0.2244	0.2782
1.03491	1.05287	1.68	1.69	-0.65	-0.7	-0.6	0.2672	0.2486	0.2858
1.03491	1.05287	1.68	1.69	-0.55	-0.6	-0.5	0.2554	0.2407	0.2701
1.03491	1.05287	1.68	1.69	-0.45	-0.5	-0.4	0.2654	0.2511	0.2797
1.03491	1.05287	1.68	1.69	-0.35	-0.4	-0.3	0.2587	0.2465	0.2709
1.03491	1.05287	1.68	1.69	-0.25	-0.3	-0.2	0.29	0.2769	0.3031
1.03491	1.05287	1.68	1.69	-0.15	-0.2	-0.1	0.284	0.2712	0.2968
1.03491	1.05287	1.68	1.69	-0.05	-0.1	0	0.2828	0.2699	0.2957
1.03491	1.05287	1.68	1.69	0.05	0	0.1	0.2699	0.2572	0.2826
1.03491	1.05287	1.68	1.69	0.15	0.1	0.2	0.3017	0.2867	0.3167
1.03491	1.05287	1.68	1.69	0.25	0.2	0.3	0.2812	0.264	0.2984
1.03491	1.05287	1.68	1.69	0.35	0.3	0.4	0.236	0.2233	0.2487
1.03491	1.05287	1.68	1.69	0.45	0.4	0.5	0.2449	0.2297	0.2601
1.03491	1.05287	1.68	1.69	0.55	0.5	0.6	0.2633	0.2455	0.2811
1.03491	1.05287	1.68	1.69	0.65	0.6	0.7	0.2439	0.2221	0.2657
where x_mean is the cos(theta) c.m. and y_mean is the cross section
[Updated on: Mon, 06 August 2012 20:32] Report message to a moderator |
|
|
|
| Re: Bear Smear and Cross Sections [message #13850 is a reply to message #13848] |
Mon, 06 August 2012 23:48   |
 Ingo Froehlich
Messages: 167
Registered: March 2004
Location: IKF - Frankfurt
|
first-grade participant |
From: *dip.t-dialin.net
|
|
I don't know if this goes in your direction but I have done something some time ago for angular distributions:
http://web-docs.gsi.de/~hadeshyp/pluto/v5.40/examples/useAngularDistribu tion.C.html
Here one can add 1-dimensional histograms to form the angular shape. Functions are also possible. The 2-dimensional functions allow to model the distribution based on the c.m. energy. I guess because you are using beam smearing, you would need some histogram based equivalent of the 2-dimensional function?
There is a caveat with these functions: they must be normalized such that the maximum is lower as 1 (I know I should get rid of this)
--
Ingo Froehlich
IKF - University of Frankfurt
069-798-47027, FAX: -47024
|
|
|
|
| Re: Bear Smear and Cross Sections [message #13852 is a reply to message #13850] |
Tue, 07 August 2012 00:49   |
 Michael Kunkel
Messages: 53
Registered: June 2011
|
continuous participant |
From: *hr.hr.cox.net
|
|
That is a strict caveat considering that there might be a situation in which the cross section for set of beam energy & c.m. cos(theta) is greater than another beam energy in c.m. cos(theta).
If each TGraph was normalized to 1, then the cross section generated would be flat in beam energy but not cos(theta) c.m.
I am attaching a plot I generated showing the cross section of eta in photoproduction in plots of beam energy. Y axis is cross section, x axis is cos(theta) c.m.
Otherwise, the idea you sent before would be outstanding.
[Updated on: Tue, 07 August 2012 00:50] Report message to a moderator |
|
|
|
| Re: Bear Smear and Cross Sections [message #13853 is a reply to message #13852] |
Tue, 07 August 2012 12:04   |
 Ingo Froehlich
Messages: 167
Registered: March 2004
Location: IKF - Frankfurt
|
first-grade participant |
From: *dip.t-dialin.net
|
|
I think it is worth the effort to develop a model where you can feed data for the total cross section as well as angular distributions. I have to think about it and will come up with a proposal
--
Ingo Froehlich
IKF - University of Frankfurt
069-798-47027, FAX: -47024
|
|
|
|
|
|
| Re: Bear Smear and Cross Sections [message #13867 is a reply to message #13858] |
Wed, 15 August 2012 08:39   |
 Ingo Froehlich
Messages: 167
Registered: March 2004
Location: IKF - Frankfurt
|
first-grade participant |
From: *x-matter.uni-frankfurt.de
|
|
I just want to let you know that I'm currently working on a template: it will use a 2-dimensional histogram (cos_theta vs. q), but attaching other sources will work as well. Therefore, folding the cross section by a beam profile will probably still work
But I still need some days...
--
Ingo Froehlich
IKF - University of Frankfurt
069-798-47027, FAX: -47024
|
|
|
|
|
|
|
|
| Re: Bear Smear and Cross Sections [message #13873 is a reply to message #13858] |
Sun, 19 August 2012 17:35   |
 Ingo Froehlich
Messages: 167
Registered: March 2004
Location: IKF - Frankfurt
|
first-grade participant |
From: *dip.t-dialin.net
|
|
I have a first example included in the latest v5.40.5 (in plugins/scatter_mod).
It is based on the usual inline script, and can be combined with one or more histogram and a new Eval(x,..) version.
The random sampling is done by the ROOT GetRandom2() method (in fact I use PF2EvalBatch which is a wrapper to TF2). One has to keep in mind that GetRandom2 has sometimes a bad performance. Also, the histograms have no interpolation yet, is one needs a higher precision one has to do the smoothing outside of the event loop.
This was done in some days only and is poorly tested.
--
Ingo Froehlich
IKF - University of Frankfurt
069-798-47027, FAX: -47024
|
|
|
|
| Re: Bear Smear and Cross Sections [message #13875 is a reply to message #13873] |
Tue, 21 August 2012 21:29   |
 Michael Kunkel
Messages: 53
Registered: June 2011
|
continuous participant |
From: 129.57.112*
|
|
Greetings,
Is there a way to incorporate the use of TGraph and/or TGraphAsymmErrors.
The distribution I am attempting does not come in equal binning.
In fact much of the distributions that would be used will look similar to data like:
	double xval[] = { -0.84, -0.75, -0.65, -0.55, -0.45, -0.35, -0.25, -0.15, -0.05, 0.05, 0.15, 0.25, 0.35, 0.45, 0.55, 0.65, 0.75 };

  double yval[] = { 0.0324, 0.0374, 0.0276, 0.0233, 0.0173, 0.0122, 0.0122, 0.0169, 0.0277, 0.0333, 0.0359, 0.0375, 0.0439, 0.0625, 0.093, 0.132, 0.1634 };
Where x is cos(theta) and y is differential cross section.
If this is not possible, I will attempt to do fitting and use the 2D functional forms.
|
|
|
|
| Re: Bear Smear and Cross Sections [message #13877 is a reply to message #13873] |
Thu, 23 August 2012 05:05   |
 Michael Kunkel
Messages: 53
Registered: June 2011
|
continuous participant |
From: *hr.hr.cox.net
|
|
Greetings,
I am not sure if I am doing something wrong, or the model technique is flawed, or both.
I have a distribution cos(theta) vs. differential cross section, see plot below
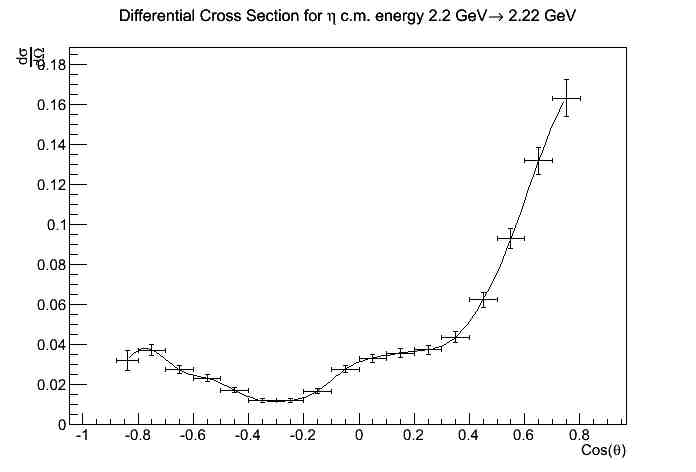
I then take this TGraph, and by using TSpline5, draw a histogram for PScatterCrossSection, see figure below.
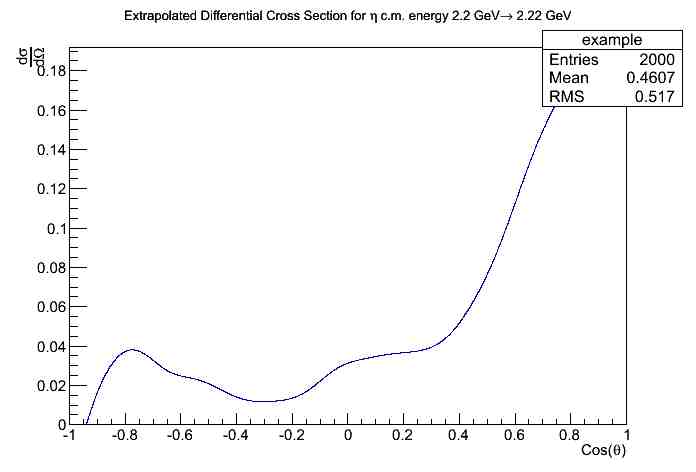
I then use this histogram as seen in the sample macro
Input: _x is c.m. cos(theta), _y is the dsig/dcos(theta)
Output: _f: cross section
model->AddHistogram(example,"value = Eval(_x); _f = _y * value");
The output of PLUTO generated looks nothing like the inputted, as it can be seen from the first 2 figure to that of the figure below
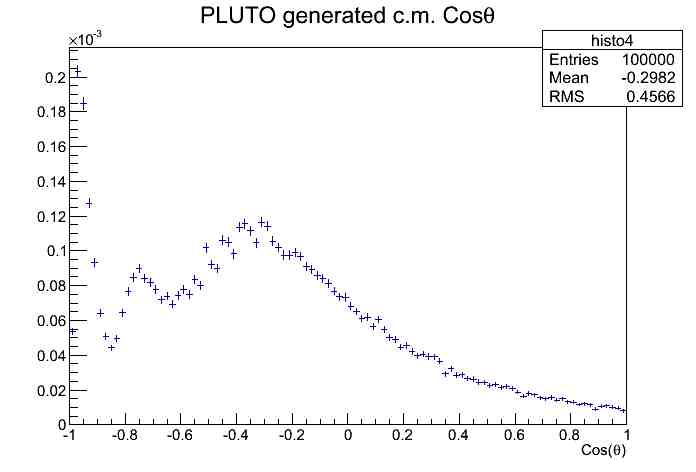
Moreover, the macro I use stipulates the c.m energy range as
model->SetRange(2.2,2.22); //in GeV
which corresponds to 2.11 to 2.16 GeV beam energy in lab frame for the reaction g p -> p eta.
As can be seen from the figures below, from using the functions
my_reaction.Do(histo1,"_x = [g+p]->M()");
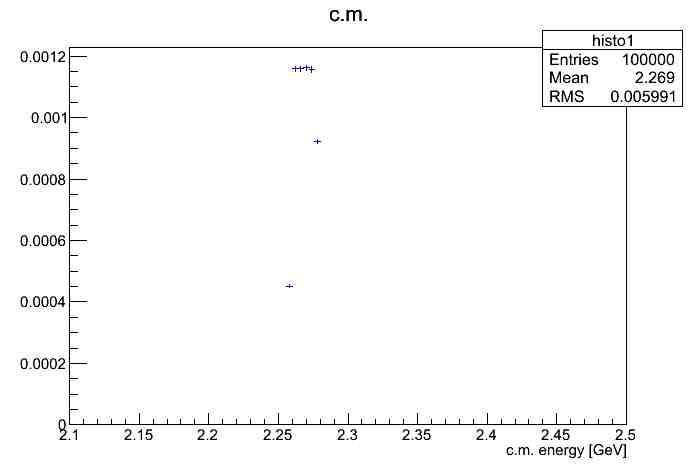
for c.m. energy, and
my_reaction.Do(beamProfile,"_x = ([g+p]->GetBeam())->E();");
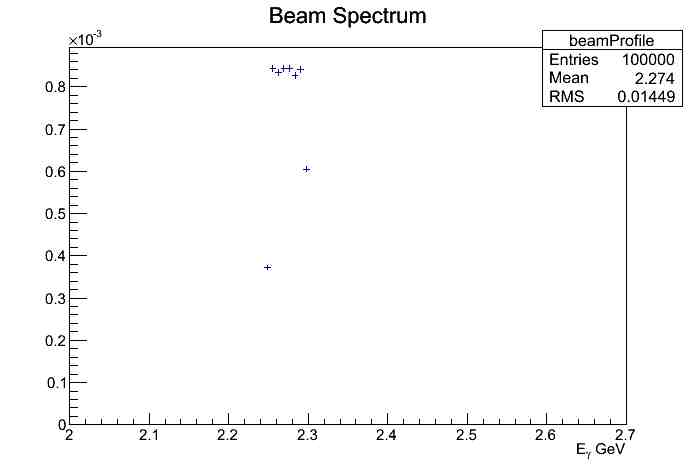
for lab energy, neither of these plots correspond to the input given in the macro.
I can no longer attach any more files, so I am adding my macro in the text body.
Another note, when using ROOTs ALCiC to compile the macro, I had to add these lines into the PScatterCrossSection.h
#include "/Users/Mike/Pluto/pluto_v5.40.5/src/PAngularDistribution.h"
#include "/Users/Mike/Pluto/pluto_v5.40.5/src/PProjector.h"
#include "/Users/Mike/Pluto/pluto_v5.40.5/src/PF2EvalBatch.h"
Here is my macro
#include "TGraphAsymmErrors.h"
#include "TH1.h"
#include "TH2.h"
#include "TH3.h"
#include "TChain.h"
#include "TCanvas.h"
#include "TF1.h"
#include "TGraphAsymmErrors.h"
#include "/Users/Mike/Pluto/pluto_v5.40.5/src/PParticle.h"
#include "/Users/Mike/Pluto/pluto_v5.40.5/src/PReaction.h"
#include "/Users/Mike/Pluto/pluto_v5.40.5/src/PBeamSmearing.h"
#include "/Users/Mike/Pluto/pluto_v5.40.5/src/PAnyDistribution.h"
#include "/Users/Mike/Pluto/pluto_v5.40.5/plugins/scatter_mod/PScatterCrossSection.h"


// 2.2 - 2.22

void eta_XSection()
{


  //From data on eta differential cross section as function of c.m. cos(theta) for c.m. energy 2.2 -> 2.22 GeV
  //Making a TGraph then fit the TGraph to a spline
  const int p7694_d47x1y1_numpoints = 17;

  double p7694_d47x1y1_xval[p7694_d47x1y1_numpoints] = { -0.84, -0.75, -0.65, -0.55, -0.45, -0.35, -0.25, -0.15, -0.05, 0.05, 0.15, 0.25, 0.35, 0.45, 0.55, 0.65, 0.75 };
	double p7694_d47x1y1_xerrminus[p7694_d47x1y1_numpoints] = { 0.040000000000000036, 0.050000000000000044, 0.04999999999999993, 0.04999999999999993, 0.04999999999999999, 0.050000000000000044, 0.04999999999999999, 0.05000000000000002, 0.05, 0.05, 0.04999999999999999, 0.04999999999999999, 0.04999999999999999, 0.04999999999999999, 0.050000000000000044, 0.050000000000000044, 0.050000000000000044 };
	double p7694_d47x1y1_xerrplus[p7694_d47x1y1_numpoints] = { 0.039999999999999925, 0.050000000000000044, 0.050000000000000044, 0.050000000000000044, 0.04999999999999999, 0.04999999999999999, 0.04999999999999999, 0.04999999999999999, 0.05, 0.05, 0.05000000000000002, 0.04999999999999999, 0.050000000000000044, 0.04999999999999999, 0.04999999999999993, 0.04999999999999993, 0.050000000000000044 };
	double p7694_d47x1y1_yval[p7694_d47x1y1_numpoints] = { 0.0324, 0.0374, 0.0276, 0.0233, 0.0173, 0.0122, 0.0122, 0.0169, 0.0277, 0.0333, 0.0359, 0.0375, 0.0439, 0.0625, 0.093, 0.132, 0.1634 };
	double p7694_d47x1y1_yerrminus[p7694_d47x1y1_numpoints] = { 0.005, 0.00291, 0.00185, 0.00166, 0.00139, 0.00102, 9.7E-4, 0.00117, 0.00178, 0.00205, 0.00215, 0.00217, 0.00258, 0.00386, 0.005, 0.0069, 0.0093 };
	double p7694_d47x1y1_yerrplus[p7694_d47x1y1_numpoints] = { 0.005, 0.00291, 0.00185, 0.00166, 0.00139, 0.00102, 9.7E-4, 0.00117, 0.00178, 0.00205, 0.00215, 0.00217, 0.00258, 0.00386, 0.005, 0.0069, 0.0093 };
	double p7694_d47x1y1_ystatminus[p7694_d47x1y1_numpoints] = { 0.0, 0.0, 0.0, 0.0, 0.0, 0.0, 0.0, 0.0, 0.0, 0.0, 0.0, 0.0, 0.0, 0.0, 0.0, 0.0, 0.0 };
	double p7694_d47x1y1_ystatplus[p7694_d47x1y1_numpoints] = { 0.0, 0.0, 0.0, 0.0, 0.0, 0.0, 0.0, 0.0, 0.0, 0.0, 0.0, 0.0, 0.0, 0.0, 0.0, 0.0, 0.0 };
	TGraphAsymmErrors *p7694_d47x1y1 = new TGraphAsymmErrors(p7694_d47x1y1_numpoints, p7694_d47x1y1_xval, p7694_d47x1y1_yval, p7694_d47x1y1_xerrminus, p7694_d47x1y1_xerrplus, p7694_d47x1y1_yerrminus, p7694_d47x1y1_yerrplus);
	p7694_d47x1y1->SetTitle("Differential Cross Section for #eta c.m. energy 2.2 GeV#rightarrow 2.22 GeV"); ///HepData/7694/d47x1y1
  p7694_d47x1y1->GetXaxis()->SetTitle("Cos(#theta)");
	p7694_d47x1y1->GetYaxis()->SetTitle("#frac{d#sigma}{d#Omega}");
  TCanvas *TgCan = new TCanvas("TgCan","TgCan");
  TgCan->cd();
	p7694_d47x1y1->Draw("AP");

  TSpline5 *s3 = new TSpline5("s3",p7694_d47x1y1);
  s3->Draw("same");


  //Now from the spline, create a TH1D histogram for PLUTO to model the Xsection with
  TH1D *example = new TH1D("example","try this",2001,-1,1);
  example->SetTitle("Extrapolated Differential Cross Section for #eta c.m. energy 2.2 GeV#rightarrow 2.22 GeV"); ///HepData/7694/d47x1y1
  example->GetXaxis()->SetTitle("Cos(#theta)");
	example->GetYaxis()->SetTitle("#frac{d#sigma}{d#Omega}");
  example->Sumw2();
  int hold = 1; //place value for histogram bin filling
//############Filling Histogram#########################
  for (double j = -1.; j<=1.; j = j +0.001) {
    double bin_content = s3->Eval(double(j));
    if(bin_content < 0.0){bin_content = 0.0;}
    //cout<<bin_content<<endl;
    example->SetBinContent(hold,bin_content);
    hold++;
  }
//################################################
  TCanvas *canf = new TCanvas("canf","canf");
  canf->cd();
  example->Draw("ep");


//PLUTO TIME

  PScatterCrossSection * model = new PScatterCrossSection("mymodel","My cross section");
  model->Add("g,grandparent,beam");
  model->Add("p,grandparent,target");
  model->Add("q,parent");
  model->Add("p,daughter");
  model->Add("eta,daughter,primary");

  //Define the range of the c.m. sampling:
  model->SetRange(2.2,2.22);  //CLAS G12 c.m. model->SetRange(1.739,3.3268);


  //model->AddEquation("my_x = s3->Eval(_x);;_f = Eval(my_x)");
  model->AddHistogram(example,"value = Eval(_x); _f =_y * value");
  makeDistributionManager()->Add(model);


  PReaction my_reaction("_P1 = 2.113","g","p","p eta [dilepton [e+ e-] g]");

  TH1F * histo1 = new TH1F ("histo1","c.m.",100,2.1,2.5);
  histo1->Sumw2();
  histo1->GetXaxis()->SetTitle("c.m. energy [GeV]");

  my_reaction.Do(histo1,"_x = [g+p]->M()");

  TH2F * histo2 = new TH2F ("histo2","c.m. vs cos_theta",100,1.0,3.0,20,-1,1);
  my_reaction.Do(histo2,"_x = [g+p]->M(); myeta = [eta]; myeta->Boost([g+p]); _y = myeta->CosTheta()");

  //This histogram shows the beam profile:
  TH1F * beamProfile = new TH1F ("beamProfile","Beam Spectrum",100,2.0,2.7);
  beamProfile->Sumw2();
  beamProfile->GetXaxis()->SetTitle("E_{#gamma} GeV");

  my_reaction.Do(beamProfile,"_x = ([g+p]->GetBeam())->E();");


  TH1F * histo4 = new TH1F ("histo4","PLUTO generated c.m. Cos#theta",100,-1,1);
  my_reaction.Do(histo4,"myeta->Boost([g+p]); _x = myeta->CosTheta()");
  histo4->GetXaxis()->SetTitle("Cos(#theta)");
  histo4->Sumw2();


  my_reaction.Print();


  my_reaction.Loop(100000);


  TCanvas *can1 = new TCanvas("can1","can1");
  can1->cd();
  histo1->Draw();

  TCanvas *can2 = new TCanvas("can2","can2");
  can2->cd();
  beamProfile->Draw("ep");
  TCanvas *can3 = new TCanvas("can3","can3");

  can3->cd();
  histo4->Draw("ep");

  //TgCan->Print("XSection_Data.jpeg");
  //canf->Print("XSection_Interpolated.jpeg");
  //can1->Print("PLUTO_generated_cm_energy.jpeg");
  //can2->Print("Beam_Profile.jpeg");
  //can3->Print("PLUTO_generated_cos_theta.jpeg");
}
Thanks for all the help
Michael
[Updated on: Thu, 23 August 2012 05:09] Report message to a moderator |
|
|
|
| Re: Bear Smear and Cross Sections [message #13884 is a reply to message #13877] |
Fri, 24 August 2012 16:28   |
 Ingo Froehlich
Messages: 167
Registered: March 2004
Location: IKF - Frankfurt
|
first-grade participant |
From: *x-matter.uni-frankfurt.de
|
|
| Michael Kunkel wrote on Thu, 23 August 2012 05:05 |
I am not sure if I am doing something wrong, or the model technique is flawed, or both.
|
As you already guessed, it was a combination. I found a typo in my calculation of the beam energy, and corrected it.
In your macro, you boosted the object "myeta" 2 times (in the histo2 and histo4 command). Therefore histo4 was corrupted. You can just remove the boost command in histo4.
I added also a SetNpx/y command in PScatterDistribution, just in case that you want to change it when you see steps (it calls just GetRandom2 via a wrapper with all the drawbacks)
The TGraph version will come later - I don't want to change too many things at the same time.
PS: Do not forget that the y-axis (a linear increase of _f) was just dummy.
--
Ingo Froehlich
IKF - University of Frankfurt
069-798-47027, FAX: -47024
|
|
|
|
| Re: Bear Smear and Cross Sections [message #13885 is a reply to message #13884] |
Fri, 24 August 2012 19:32   |
 Michael Kunkel
Messages: 53
Registered: June 2011
|
continuous participant |
From: 129.57.112*
|
|
Thanks for showing me my error.
A few more questions/observations.
I am unable to run macros unless I use the full path of PF2EvalBatch.h in the PScatterCrossSection.h
Error: cannot open file "PF2EvalBatch.h" /Users/Mike/Pluto/pluto_v5.40.5/plugins/scatter_mod/PScatterCrossSection.h:15:
Also, I am unclear on what SetNpx/y does. Looking in the code I see that on line 58
if (npy>0) pf2->SetNpx(npy);
Is this suppose to be SetNpx for npy? Could you also elaborate more on this functionality?
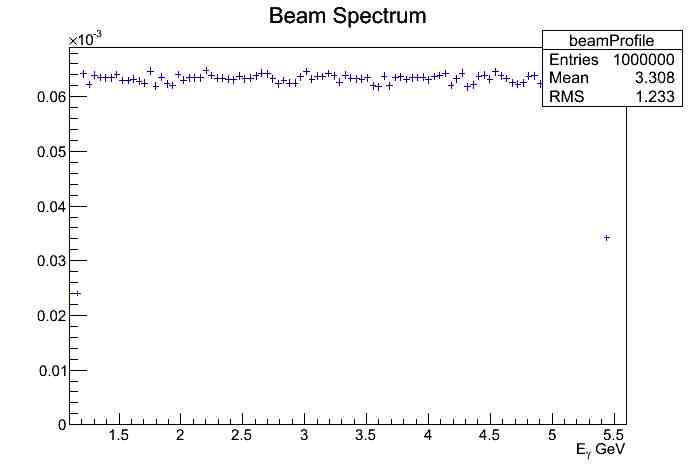
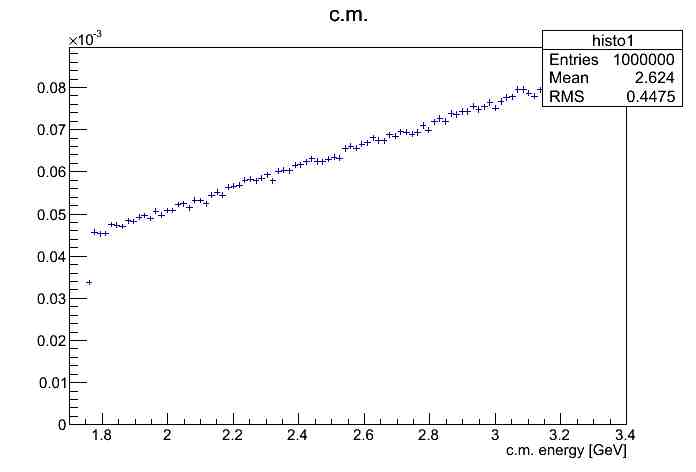
Also, beam smearing is not working with the PScatterCrossSection. I checked this by smearing the beam 1.1 -> 5.7 GeV in the lab, translating this to c.m. energy and generate. The lab beam distribution is flat, instead of a bremsstrahlung (1/x) function I input into beam smear, however the c.m energy is not flat(see below). I am sure I know a work around for this, but I thought I would bring it to your attention.
Lab Frame:
c.m. Frame:
And lastly,
| Quote: |
PS: Do not forget that the y-axis (a linear increase of _f) was just dummy.
|
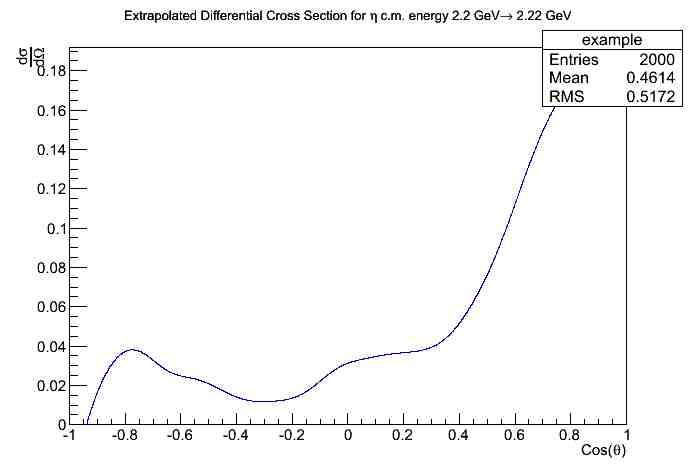
I do not understand this. Once I corrected my sytax for my double boost, I checked my distributed cos(theta) of the PLUTO generation. It looks like the input. (see below) Would you also elaborate more on on the meaning of your P.S.
Thanks
Michael
INPUT:
PLUTO OUTPUT:
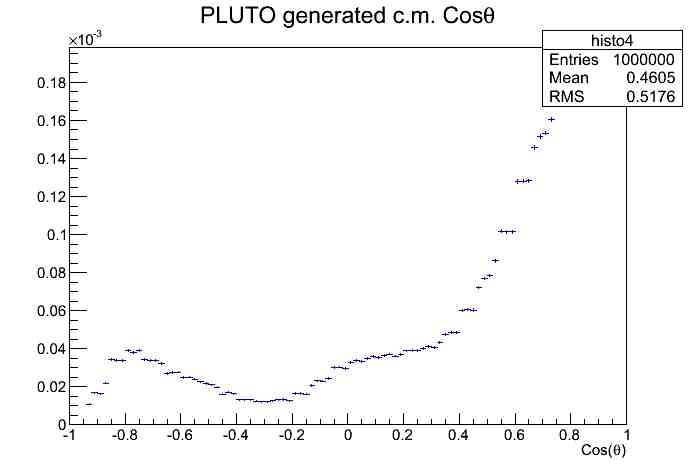
[Updated on: Fri, 24 August 2012 19:33] Report message to a moderator |
|
|
|
| Re: Bear Smear and Cross Sections [message #13886 is a reply to message #13885] |
Mon, 27 August 2012 09:22   |
 Ingo Froehlich
Messages: 167
Registered: March 2004
Location: IKF - Frankfurt
|
first-grade participant |
From: *dip.t-dialin.net
|
|
| Michael Kunkel wrote on Fri, 24 August 2012 19:32 |
Also, I am unclear on what SetNpx/y does. Looking in the code I see that on line 58
if (npy>0) pf2->SetNpx(npy);
Is this suppose to be SetNpx for npy? Could you also elaborate more on this functionality?
|
This is just a typical copy-and-paste typo. I will correct it.
SetNpx/Npy are just forwarded to the TF2 base class. They have the same meaning as there (precision vs. computing time)
| Michael Kunkel wrote on Fri, 24 August 2012 19:32 |
Also, beam smearing is not working with the PScatterCrossSection. ....
....
| Quote: |
PS: Do not forget that the y-axis (a linear increase of _f) was just dummy.
|
I do not understand this. Once I corrected my sytax for my double boost, I checked my distributed cos(theta) of the PLUTO generation. It looks like the input. (see below) Would you also elaborate more on on the meaning of your P.S.
Thanks
Michael
|
I think I should explain the meaning of this method a little bit more. It is a function based on _x (cos theta) and _y (total c.m. energy). The class samples the density function with GetRandom2(), and sets the resulting angle and the c.m. energy of the system. Therefore, the beam smearing cannot be used in this case. You have to fold the beam smearing inside the function.
All this could be in fact also be realized with a TF2 class. But the class PF2EvalBatch is more flexible. You can merge one (or more) histograms with the function, if you want you can use one histogram for cos theta and another one for the cross section (and/or beam smearing), or a 2dimensional histogram, or just an analytical function. Therefore, in my dummy example you have the replace the calculation of _y (linear function) with some meaningful (if you look carefully you can also see the dummy linear function in your plot).
I have chosen c.m. instead of beam energy because it is an invariant. This is important if somebody uses the class for near-threshold sampling in a deuteron or heavy nucleon with fermi momentum.
--
Ingo Froehlich
IKF - University of Frankfurt
069-798-47027, FAX: -47024
[Updated on: Mon, 27 August 2012 09:22] Report message to a moderator |
|
|
|
| Re: Bear Smear and Cross Sections [message #13892 is a reply to message #13886] |
Mon, 27 August 2012 21:07   |
 Michael Kunkel
Messages: 53
Registered: June 2011
|
continuous participant |
From: *hr.hr.cox.net
|
|
| Quote: |
I think I should explain the meaning of this method a little bit more. It is a function based on _x (cos theta) and _y (total c.m. energy). The class samples the density function with GetRandom2(), and sets the resulting angle and the c.m. energy of the system. Therefore, the beam smearing cannot be used in this case. You have to fold the beam smearing inside the function.
All this could be in fact also be realized with a TF2 class. But the class PF2EvalBatch is more flexible. You can merge one (or more) histograms with the function, if you want you can use one histogram for cos theta and another one for the cross section (and/or beam smearing), or a 2dimensional histogram, or just an analytical function. Therefore, in my dummy example you have the replace the calculation of _y (linear function) with some meaningful (if you look carefully you can also see the dummy linear function in your plot).
|
I noticed in the example macro,
    //Now add the histogram to the model class, and define an equation
    //Input:  _x is cos(theta), _y is the c.m. energy
    //Output: _f: cross section
Is _f the density function? If so, wouldn't using Input : _x s cos(theta), _y is differential cross section
Output : cross section
I ask this, because I have 64 different models I want to use, each a segment of c.m. energy covering the range 1.68 - 2.84 GeV in the c.m. frame.
So eventually I am going to be adding 64 models, each model has a different cross section, ie the cross section at 1.68 GeV is much higher then the cross section and 2.84 by a factor ~ 100. So I would like to make sure what I model this, this scaling is taking into effect.
Would you please elaborate more on how to add more histograms into the model to ensure I get the right topology with the scaleing of the cross sections, the beam smearing, etc. I have having a hard time understanding everything so far.
Thanks
|
|
|
|
| Re: Bear Smear and Cross Sections [message #13893 is a reply to message #13892] |
Mon, 27 August 2012 22:59   |
 Ingo Froehlich
Messages: 167
Registered: March 2004
Location: IKF - Frankfurt
|
first-grade participant |
From: *dip.t-dialin.net
|
|
| Michael Kunkel wrote on Mon, 27 August 2012 21:07 |
Is _f the density function? If so, wouldn't using Input : _x s cos(theta), _y is differential cross section
Output : cross section
|
No, it's a very simple implementation: there are 2 input variables, mapped on the 2 axis of TF2, and one output variable, named _f, and this is the return value of the TF2. How you fill the _f is up to you, but it must be defined.
| Michael Kunkel wrote on Mon, 27 August 2012 21:07 |
I ask this, because I have 64 different models I want to use, each a segment of c.m. energy covering the range 1.68 - 2.84 GeV in the c.m. frame.
|
Than maybe the simplest method is that you use a 2-dimensional histogram, if the binning is the same for all the models, it should be no problem to merge them. Keep in mind that there is no linear interpolation implemented yet.
| Michael Kunkel wrote on Mon, 27 August 2012 21:07 |
Would you please elaborate more on how to add more histograms into the model to ensure I get the right topology with the scaleing of the cross sections, the beam smearing, etc. I have having a hard time understanding everything so far.
|
You can concat the calculation:
model->AddHistogram(distribution1,"_f = Eval(_x. _y);");
model->AddHistogram(distribution2,"_f = _f * Eval(_x. _y);");
or
model->AddHistogram(distribution3,"_f = _f * Eval(_y);");
as indicated in the example, you can also make transformations:
model->AddEquation("t_lab = (_y*_y - g.mass*g.mass - p.mass*p.mass)/(2*p.mass*p.mass) - g.mass;");
model->AddHistogram(profile,"_f = _f * Eval(t_lab);");
...just in case that your histogram profile is a function of t_lab.
In the same way you can replace a beam profile by an analytical function.
--
Ingo Froehlich
IKF - University of Frankfurt
069-798-47027, FAX: -47024
[Updated on: Mon, 27 August 2012 23:01] Report message to a moderator |
|
|
|
| Re: Bear Smear and Cross Sections [message #13894 is a reply to message #13893] |
Tue, 28 August 2012 01:32   |
 Michael Kunkel
Messages: 53
Registered: June 2011
|
continuous participant |
From: *hr.hr.cox.net
|
|
I do understand that my thoughts are hard to convey, I appreciate the time you are taking with this. I wanted to clarify a typo in my previous message.
Instead of
| Michael Kunkel wrote on Mon, 27 August 2012 21:07 |
Is _f the density function? If so, wouldn't using Input : _x s cos(theta), _y is differential cross section
Output : cross section
|
I wanted to say
Is _f the density function? If so, wouldn't using Input : _x s cos(theta), _y is differential cross section
Output : _f cross section
What I am finding hard to conceive here is how the distribution is generated.
Moreover, I want to clarify what I am trying to do, and hopefully I can understand my mistakes after this.
I have 64 models I will be using. I was assuming I could implement this as
  model1->SetRange(1.77,1.8);
...
...
...
  model64->SetRange(2.56,2.6);

  model1->AddHistogram(example1,"value = Eval(_x); _f =_y * value");
  makeDistributionManager()->Add(model1);
  ...
  ...
  ...
  model64->AddHistogram(example64,"value = Eval(_x); _f =_y * value");
  makeDistributionManager()->Add(model64);
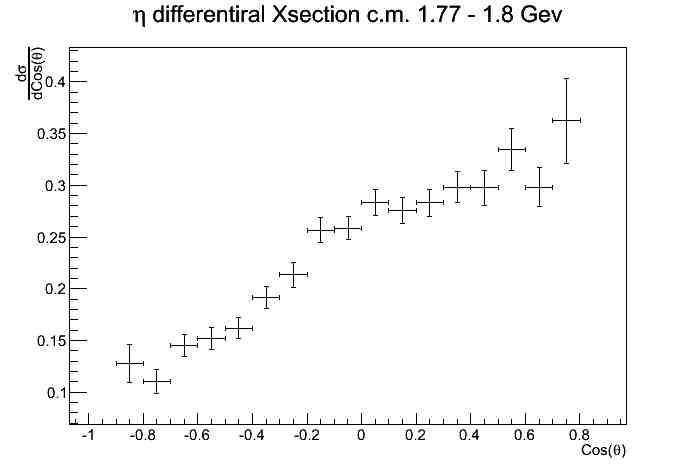
In the above snipet I use 1 histogram for each model. Each histogram is derived from published data with
_x = Cos(theta)
_y = Differential Cross section
The histograms are extrapolated from TGraphs (see below);
c.m. 1.77 ->1.8 GeV
c.m. 2.56 ->2.6 GeV
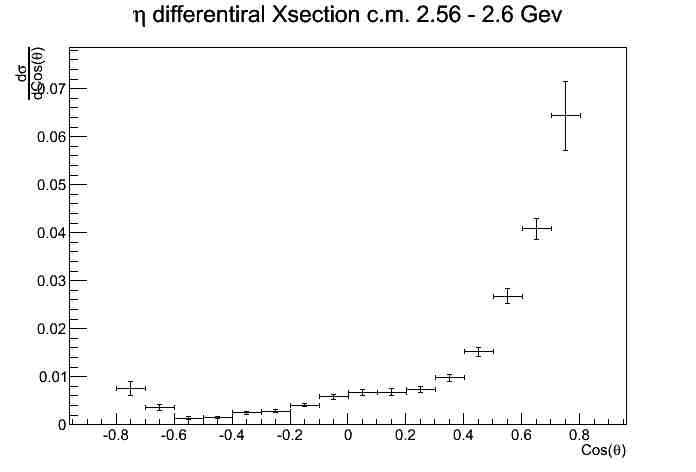
As it can be seen from the plots above, the cross section depends on both the c.m. energy and Cos(theta);
I am trying to model this, however the example macro you provided states (lines 31 & 32):
    //Input:  _x is cos(theta), _y is the c.m. energy
    //Output: _f: cross section
model->AddHistogram(distribution,"value = Eval(_x); _f = _y * value");
But cross section, from a physics stand point is proportional to Cos(theta) / s, where s is square of c.m. energy.
This is my a source of my confusion and also not understanding how to use what I already have, cos(theta) vs. diff XSection, is the other part of my confusion.
Thanks
[Updated on: Tue, 28 August 2012 01:34] Report message to a moderator |
|
|
|
| Re: Bear Smear and Cross Sections [message #13895 is a reply to message #13894] |
Tue, 28 August 2012 08:35   |
 Ingo Froehlich
Messages: 167
Registered: March 2004
Location: IKF - Frankfurt
|
first-grade participant |
From: *dip.t-dialin.net
|
|
| Michael Kunkel wrote on Tue, 28 August 2012 01:32 |
I wanted to say
Is _f the density function? If so, wouldn't using Input : _x s cos(theta), _y is differential cross section
Output : _f cross section
|
No, that's not correct. _x is cos(theta), and _y is the c.m. energy. It's a 2-dimensional function. _f is the results, and this is (dsigma/d(cos(theta)))(q), i.e. the differential cross section as a function of cos(theta) and q
| Michael Kunkel wrote on Tue, 28 August 2012 01:32 |
I have 64 models I will be using. I was assuming I could implement this as
  model1->SetRange(1.77,1.8);
...
...
...
  model64->SetRange(2.56,2.6);

  model1->AddHistogram(example1,"value = Eval(_x); _f =_y * value");
  makeDistributionManager()->Add(model1);
  ...
  ...
  ...
  model64->AddHistogram(example64,"value = Eval(_x); _f =_y * value");
  makeDistributionManager()->Add(model64);
|
No, this will not work. Pluto is a sampling event generator. If you use it like this, the first model samples theta and q, the second model overwrites that, and so on...
| Michael Kunkel wrote on Tue, 28 August 2012 01:32 |
In the above snipet I use 1 histogram for each model. Each histogram is derived from published data with
_x = Cos(theta)
_y = Differential Cross section
|
You are using a different convention, this is part of the confusion. _y is the c.m. energy in a 2-dimensional function. If you are using a 1-dimensional histogram, the results should be still mapped on _f, not _y.
The only thing you have to implement is a function _f = F(_x,_y) = F(cos(theta),q)
--
Ingo Froehlich
IKF - University of Frankfurt
069-798-47027, FAX: -47024
|
|
|
|
| Re: Bear Smear and Cross Sections [message #13896 is a reply to message #13812] |
Tue, 28 August 2012 08:53   |
 Ingo Froehlich
Messages: 167
Registered: March 2004
Location: IKF - Frankfurt
|
first-grade participant |
From: *dip.t-dialin.net
|
|
You can also construct in a similar way like follows, but I haven't tested the performance with 64 if-constructions
    TH1F *distribution = new TH1F("distribution", "Angular distribution", 10, -1 , 1 );
    distribution->SetBinContent(1,20.);
    distribution->SetBinContent(2,16.);
    distribution->SetBinContent(3,11.);
    distribution->SetBinContent(4,8.);
    distribution->SetBinContent(5,5.);
    distribution->SetBinContent(6,4.);
    distribution->SetBinContent(7,3.);
    distribution->SetBinContent(8,2.5);
    distribution->SetBinContent(9,2.);
    distribution->SetBinContent(10,1.);

    TH1F *distribution2 = new TH1F("distribution2", "Angular distribution2", 10, -1 , 1 );
    distribution2->SetBinContent(1,10.);
    distribution2->SetBinContent(2,11.);
    distribution2->SetBinContent(3,12.);
    distribution2->SetBinContent(4,13);
    distribution2->SetBinContent(5,14);
    distribution2->SetBinContent(6,17);
    distribution2->SetBinContent(7,30);
    distribution2->SetBinContent(8,40);
    distribution2->SetBinContent(9,45);
    distribution2->SetBinContent(10,60);

    TH1F *distribution3 = new TH1F("distribution3", "Angular distribution2", 10, -1 , 1 );
    distribution3->SetBinContent(1,1.);
    distribution3->SetBinContent(2,1.);
    distribution3->SetBinContent(3,1.);
    distribution3->SetBinContent(4,1);
    distribution3->SetBinContent(5,1);
    distribution3->SetBinContent(6,1);
    distribution3->SetBinContent(7,3);
    distribution3->SetBinContent(8,4);
    distribution3->SetBinContent(9,4);
    distribution3->SetBinContent(10,6);

    model->AddHistogram(distribution,"if (_y < 1.601) _f = Eval(_x);");
    model->AddHistogram(distribution2,"if (_y > 1.600 && _y < 1.801) _f = Eval(_x);");
    model->AddHistogram(distribution3,"if (_y > 1.800) _f = Eval(_x);");
--
Ingo Froehlich
IKF - University of Frankfurt
069-798-47027, FAX: -47024
|
|
|
|
| Re: Bear Smear and Cross Sections [message #13920 is a reply to message #13812] |
Sun, 02 September 2012 16:11   |
 Michael Kunkel
Messages: 53
Registered: June 2011
|
continuous participant |
From: *110.141.123.dynamic.ttnet.com.tr
|
|
I have tried to implement what you have written so far. I have run into some more questions. I use 64 models for the energy range 1.74 - 3.33 GeV in the c.m. frame. something I find strange is that in certain energy regions, PLUTO generates the cross section oddly. In the figure below, the PLUTO generated c.m. energy is depicted.
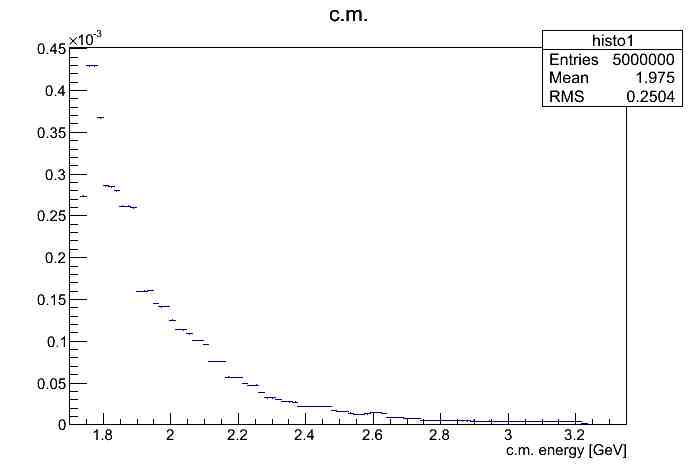
Notice the jump in "integrated cross section" between 1.89 and 1.91 GeV. This can be seen easier in the next figure below.
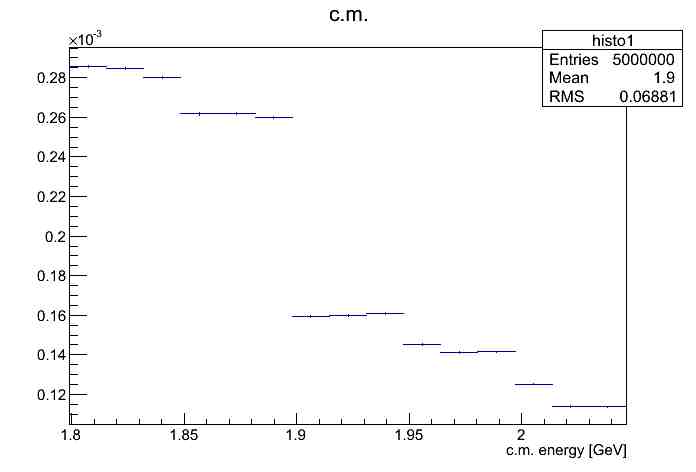
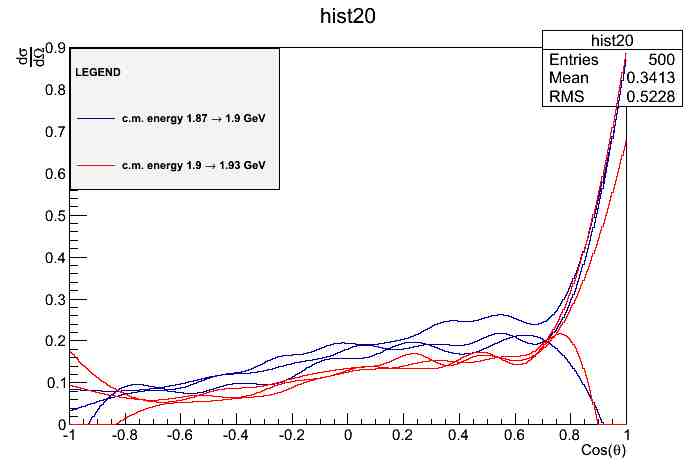
However, if I look at the differential cross sections for these energy ranges, I do not see a cause for this "jump", see figure below. (The shown plots are the interpolated plots from TGraphs)
Could you please clarify what is going on here?
Also, I was hoping you would look over my macro and see if maybe there was a mistake in my syntax that might have caused this issue. I am uploading the code.
EDITED:
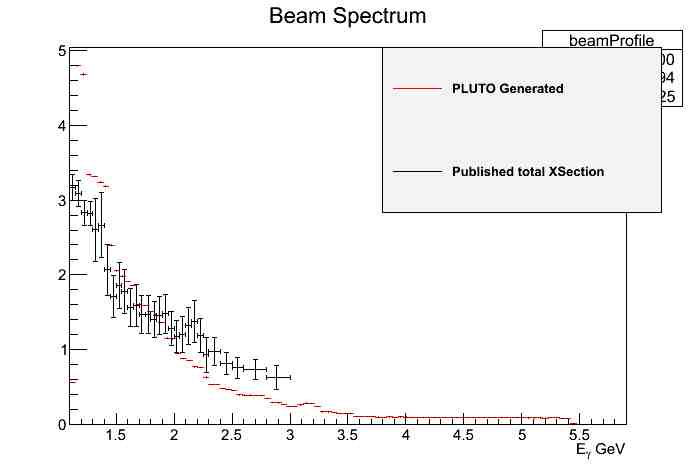
Furthermore, I have plotted the published lab energy vs. total cross section and compared it to what PLUTO generates. There is a scaling factor, however this is just a constant onto one of the spectrum.
As seen below, at small energies, there is a discrepancy as seen mentioned previously.
Thanks
Michael
[Updated on: Sun, 02 September 2012 17:15] Report message to a moderator |
|
|
|
| Re: Bear Smear and Cross Sections [message #13922 is a reply to message #13920] |
Mon, 03 September 2012 16:54   |
 Ingo Froehlich
Messages: 167
Registered: March 2004
Location: IKF - Frankfurt
|
first-grade participant |
From: *x-matter.uni-frankfurt.de
|
|
Could you upload the file Ntuple_EtaHist.root somewhere so that I can use it for testing?
My first naive assumption is that the granularity is not sufficient. Most of your slices in q have only 0.01 GeV difference. You would like to cover a range from 1.739 to 3.3268 GeV, thus a range of 1.5878 GeV. This means you need a grid of 158 grid points of the TF2 at least.
I just notices that the ROOT default value is 30!
Can you try a higher value e.g. "model->SetNpy(500)"? This can take much more computing time - the ROOT GetRandom2 algorithm is very inefficient.
--
Ingo Froehlich
IKF - University of Frankfurt
069-798-47027, FAX: -47024
|
|
|
|
|
|
|
|
|
|
| Re: Bear Smear and Cross Sections [message #13932 is a reply to message #13931] |
Wed, 05 September 2012 13:49   |
 Michael Kunkel
Messages: 53
Registered: June 2011
|
continuous participant |
From: *110.141.123.dynamic.ttnet.com.tr
|
|
| Quote: |
One can easily play with it already before the event loop by adding the following line in PScatterCrossSection.h:
PF2EvalBatch *GetFunction(void) {return pf2;};
|
When I add that line into the .h file, I get the error
Error: Can't call PScatterCrossSection::GetFunction() in current scope Draw_q_costheta.C:206:
Possible candidates are...
(in PScatterCrossSection)
(in PAngularDistribution)
(in PDistribution)
(in TF1)
(in TFormula)
Error: non class,struct,union object GetFunction() used with . or -> Draw_q_costheta.C:206:
*** Interpreter error recovered ***
I placed that line into the protected section of the .h file.
I also placed it in the public, but still did not work.
Also, what would linear interpolation do? I would think with the histograms fitted and filled to be smooth, further interpolation would not be needed.
[Updated on: Wed, 05 September 2012 13:50] Report message to a moderator |
|
|
|
| Re: Bear Smear and Cross Sections [message #13933 is a reply to message #13932] |
Wed, 05 September 2012 14:00   |
 Ingo Froehlich
Messages: 167
Registered: March 2004
Location: IKF - Frankfurt
|
first-grade participant |
From: *x-matter.uni-frankfurt.de
|
|
| Michael Kunkel wrote on Wed, 05 September 2012 13:49 |
I placed that line into the protected section of the .h file.
I also placed it in the public, but still did not work.
|
Did you recompiled?
| Michael Kunkel wrote on Wed, 05 September 2012 13:49 |
Also, what would linear interpolation do? I would think with the histograms fitted and filled to be smooth, further interpolation would not be needed.
|
An interpolation in q. As you see you have the steps between the slices in q.
--
Ingo Froehlich
IKF - University of Frankfurt
069-798-47027, FAX: -47024
|
|
|
|
| Re: Bear Smear and Cross Sections [message #13938 is a reply to message #13933] |
Wed, 05 September 2012 14:16   |
 Michael Kunkel
Messages: 53
Registered: June 2011
|
continuous participant |
From: *110.141.123.dynamic.ttnet.com.tr
|
|
| Quote: |
Did you recompiled?
|
Yes I recompiled, twice each time.
| Quote: |
An interpolation in q. As you see you have the steps between the slices in q.
|
I was under the assumption that when q was sampled, it was sampled uniformly with TRandom2, so maybe I am naive in thinking that any steps that are produced are because of the sampling of costheta and not q.
Edit: I don't know why it didn't recompile properly before, but it is working now.
[Updated on: Wed, 05 September 2012 14:21] Report message to a moderator |
|
|
|
| Re: Beam Smear and Cross Sections [message #13939 is a reply to message #13812] |
Wed, 05 September 2012 15:03   |
 Michael Kunkel
Messages: 53
Registered: June 2011
|
continuous participant |
From: *110.141.123.dynamic.ttnet.com.tr
|
|
Another request,
In the case of my data, my final state observables are only in the forward direction, therefore it is a waste of CPU time to generate the whole -1 to 1 range.
Could there be a default -1 to 1,, but is user wants to pre-skim allow
PScatterCrossSection::PScatterCrossSection(const Char_t *id, const Char_t *de) :
    PAngularDistribution(id, de) {

    beam = target = NULL;
    pf2  = NULL;
    qmax = 0.0;
    qmin = -1;
    npx = npy = -1;

    TF1 * dummy = new TF1("dummy","1",-1,1);
    SetAngleFunction(dummy);

} ;
To be over written with user values?
|
|
|
|
| Re: Beam Smear and Cross Sections [message #13982 is a reply to message #13812] |
Wed, 19 September 2012 20:17  |
 Michael Kunkel
Messages: 53
Registered: June 2011
|
continuous participant |
From: 129.57.115*
|
|
Greetings
If I had 2 beam profiles (in the lab frame), one for the bremsstrahlung distribution
and one to model a trigger for the beam, would it be accurate to do the following:
model->AddEquation("t_lab = (_y*_y - g.mass*g.mass - p.mass*p.mass)/(2*p.mass*p.mass) - g.mass;");
model->AddHistogram(brem_profile,"_f = _f * Eval(t_lab);");
model->AddHistogram(trigger_profile,"_f = _f * Eval(t_lab);");
Thanks
Michael
|
|
|
|
Goto Forum:
Current Time: Sat Jul 12 05:36:03 CEST 2025
Total time taken to generate the page: 0.01033 seconds
|
 GSI Forum


