| Scalers in prespec software [message #19494] |
Wed, 31 August 2016 13:41 |
 Michael Reese
Messages: 9
Registered: August 2016
|
occasional visitor |
From: *gsi.de
|
|
There is a feature in the prespec package, that allows to plot a ratio of two scaler values (s1 and s2) over time.
If the s2 is just the time (the time can be interpreted as scaler value that is increased with a constant frequency), then a plot of the rate of s1 over time is obtained.
The keyword for this is
rate s1:s2 resolution,duration
where resolution determines how wide the bins of the rate-histogram will be, and duration says how much time (in units of s2) the rate-histogram covers.
For example, If one adds the following lines to the file "Daq/scaler.config" in the analysis scritp (the one that was running online analysis during 2014 campaign)
processor Blub/test1 UTILS.Pair
	first <- Daq/Scaler.trlo41_line3_09_ACC_TRIG10_part_sc41_reduced
	second <- Daq/Scaler.time
	rate first:second 1.0,100 in test
end

processor Blub/test2 UTILS.Pair
	first <- Daq/Scaler.trlo25_line2_09_Free_TRIG10
	second <- Daq/Scaler.time
	rate first:second 1.0,100 in test
end

processor Blub/test3 UTILS.Pair
	first <- Daq/Scaler.trlo25_line2_09_Free_TRIG10
	second <- Daq/Scaler.trlo41_line3_09_ACC_TRIG10_part_sc41_reduced
	rate first:second 1000.0,1000000 in test
end
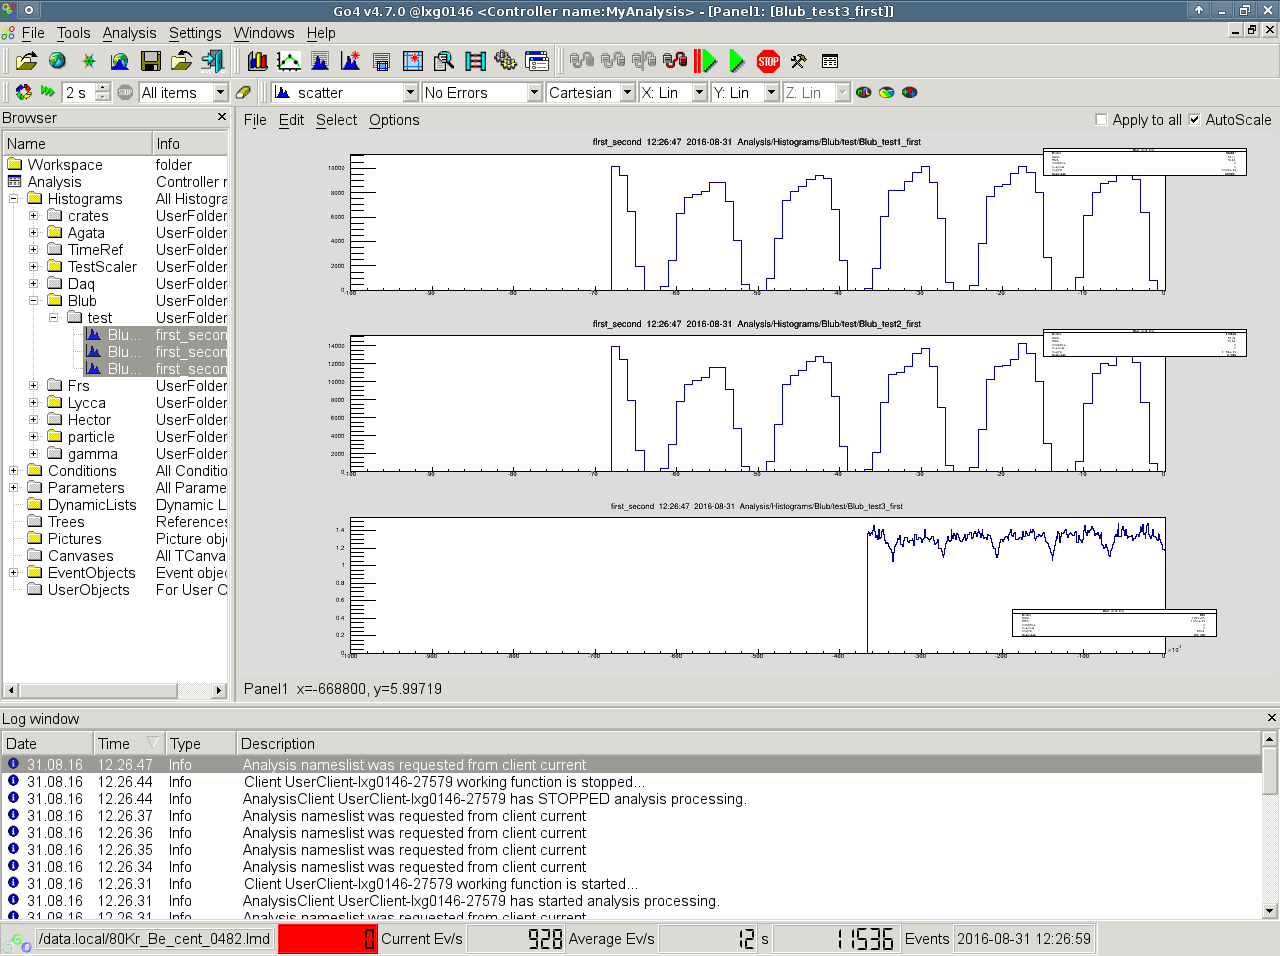
The following will appear in Go4 (from the lowest histogram, one can read that the ratio of the two scalers is around 1.3)
|
|
|
|
 GSI Forum


