| Re: Tracking efficiency release/jan14 [message #15913 is a reply to message #15900] |
Tue, 04 March 2014 12:50   |
 Susanna Costanza
Messages: 33
Registered: January 2008
Location: Pavia
|
continuous participant |
From: *pv.infn.it
|
|
Dear all,
I've reproduced (part of) the studies I've done for the TDR.
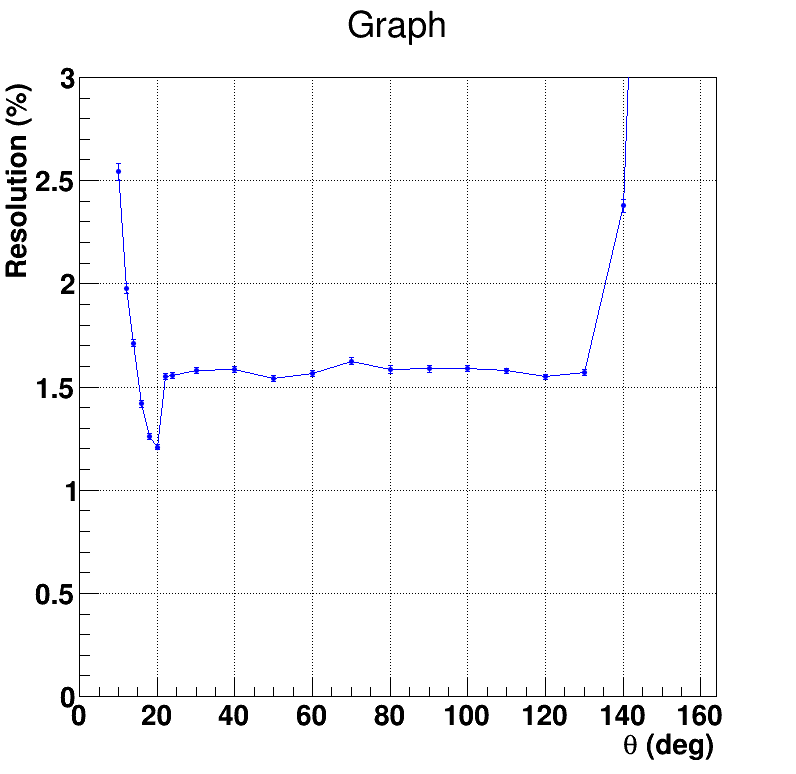
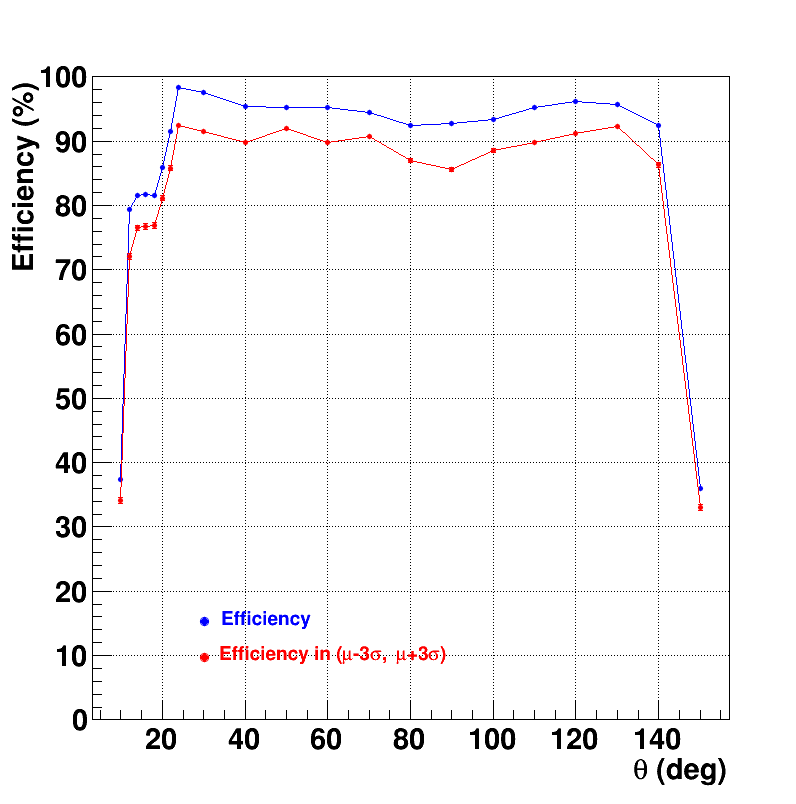
In particular, I've simulated different sets of 10000 muon single track events, generated at the I.P., with phi in (0., 360.) deg. The theta angular range has been scanned as follows:
- theta = 10, 12, ..., 24 deg in steps of 2 deg (+/- 1 deg)
- theta = 30, 40, ..., 150 deg in steps of 10 deg (+/-5 deg).
The events have been reconstructed (considering only the barrel detectors, not the ones in the forward region) and the Kalman fit has been performed only once; the tracks have then been back propagated with the PndPidCorrelator.
The momentum distributions have been fitted with a Gauss function in the range (mu-3sigma, mu+3sigma), as in the TDR.
The efficiency is calculated as the histogram integral divided by the number of generated tracks (blue curve). The red curve represents the efficiency "in peak", i.e. the number of tracks in the fitted range with respect to the total number of tracks (as in the TDR).
The results are shown in the two plots that are attached to the message: the results are comparable to the TDR ones.
Best regards,
Susanna
 
|
|
|
|
 GSI Forum


