Home » Fairroot » General Discussion » New Update causing problems and Output Data analysis
| New Update causing problems and Output Data analysis [message #13546] |
Tue, 29 May 2012 20:18  |
 Raghav Kunnawalkam
Messages: 63
Registered: February 2012
Location: Stony Brook, New York
|
continuous participant |
From: *physics.sunysb.edu
|
|
Hi All
Firstly i wanted to report the new update of fairroot that i did (this morning) is giving me some errors while loading libBase.so
dlopen error: dlopen(/Users/raghav/fairroot/build/lib/libBase.so, 9): Symbol not found: __ZTI6TProof
Referenced from: /Users/raghav/fairroot/build/lib/libBase.so
Expected in: flat namespace
in /Users/raghav/fairroot/build/lib/libBase.so
Load Error: Failed to load Dynamic link library /Users/raghav/fairroot/build/lib/libBase.so
(int)(-1)
root [1]
Now I have some questions regarding the meaning of some of the leaves in the standard output format.
1. For example say that i have all the hits in the ECAL of my detector presented as
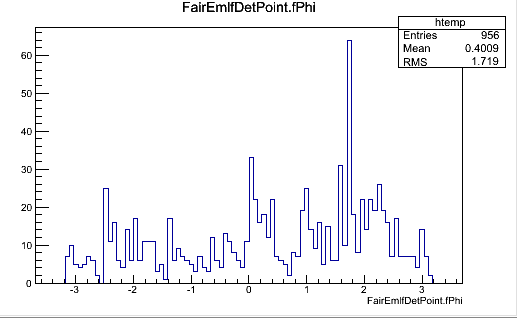
Is there a way that i can identify what particle exactly went where, like what is the particle that caused the peak about 2radians.
2. I think that there should be a way to get that information like we did during the radiation length analysis like
track->GetMomentum(), GetTheta etc..., is there a way like this to get the energy of the particle that it deposited or should i calculate it from the other ways.
3. I dont know what these leaves mean, in the root file that is produced generally.
for example, MCTrack.fNPoints, .fMotherId, .fPdgCode (i can guess what thas, but still it doesnt make sense)
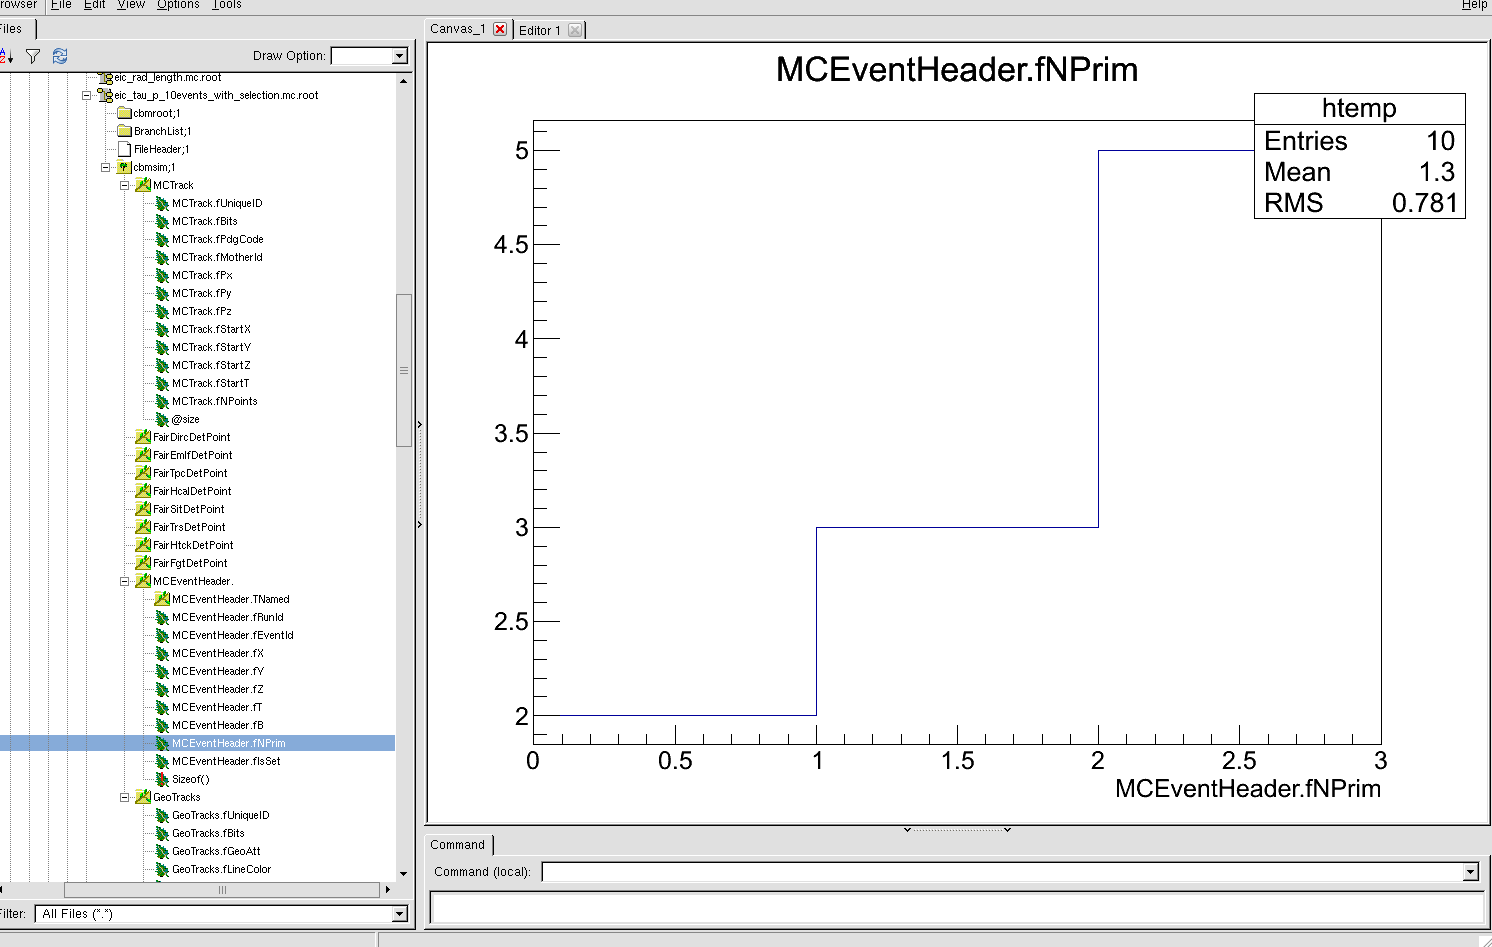
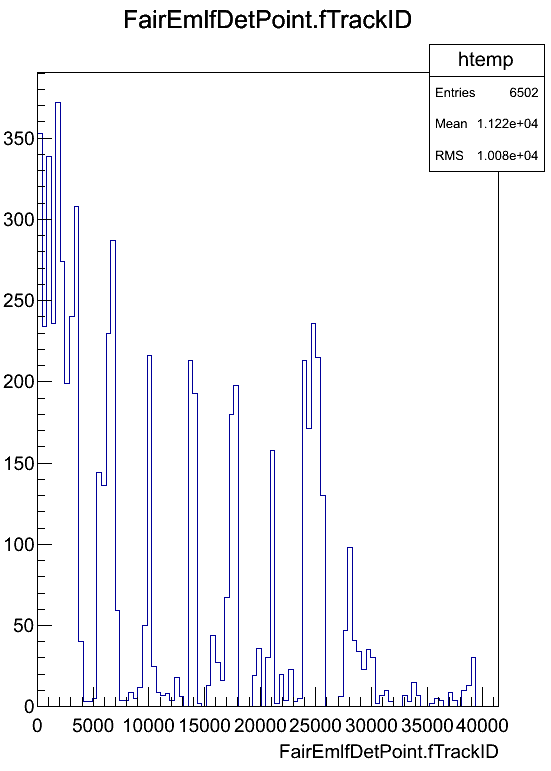
And i would really appreciate it if someone can tell me what do these following plots mean, and why root crashes i try to open the GeoTracks branch
Thanks a lot for all your help
Cheers
Raghav
[Updated on: Tue, 29 May 2012 20:53] Report message to a moderator |
|
|
|
| Re: New Update causing problems and Output Data analysis [message #13547 is a reply to message #13546] |
Wed, 30 May 2012 00:00   |
 Radoslaw Karabowicz
Messages: 108
Registered: June 2004
Location: GSI
|
continuous participant |
From: *dip0.t-ipconnect.de
|
|
Dear Raghav,
Before loading libBase.so you have to load in several libraries, which you probably do in some macro. Please add there following libraries:
gSystem->Load("libProof");
gSystem->Load("libProofPlayer");
As for your later questions:
1. I am not really sure what information is saved in FairEmlfDetPoint, but usually we also save the position (x,y,z). You can do
cbmsim->Draw("FairEmlfDetPoint.fY:FairEmlfDetPoint.fX"); it will give you a 2D with all the points - there you can see if the points with phi~2 really are aligned into one trajectory.
The other possibility is to plot the fTrackId with a cut, like:
cbmsim->Draw("FairEmlfDetPoint.fTrackId","abs(FairEmlfDetPoint.fPhi-2.) <0.2"); this will give you track ids of all points that have fPhi from 1.8 to 2.2
2. Do you mean Eloss? It is stored in each point:
FairEmlfDetPoint->GetEnergyLoss() or
cbmsim->Draw("FairEmlfDetPoint.fELoss");
3. It should be rather clear from the name, what the member value mean:
fNPoints - number of track points
fMotherId - the id of mother particle, can be only calculated for the secondaries produced in Geant, the particles that are Geant input (primaries), will all have fMotherId = -1
fPdgCode - pdg code of the particle
Can you be more explicit, why it does not make sense?
plots:
MCEventHeader.fNPrim, if I were to guess, I would say you have 10 events in total: 2 events with 0 primaries, 3 with 1 primary and 5 events with 2 primaries.
FairEmlfDetPoint.fTrackId - that distribution looks a bit strange... Normally one does not have so large trackIds, but I haven't got much experience with ecal...
Are you saving GeoTracks?
yours
radek
|
|
|
|
| Re: New Update causing problems and Output Data analysis [message #13548 is a reply to message #13547] |
Wed, 30 May 2012 15:47   |
 Raghav Kunnawalkam
Messages: 63
Registered: February 2012
Location: Stony Brook, New York
|
continuous participant |
From: *physics.sunysb.edu
|
|
Hi Radek
Many thanks for your detailed response.
a) i have included the new libraries and it works.
b) regarding the output file. I have created a bunch of detectors to simulate the EIC collider so i have 9 detectors taking input (on which i have deactivated one of them for simplicity).
I have built them just the way you guys have given in the fairroot website as a tutorial for building new detectors.
I can see that from the TBrowser, I can draw these plots quite easily but it is a pain to keep doing it again and again for all my detectors. So i wanted to create a macro that does it automatically for all of them. Thats why i asked you about the getting the Energy loss etc... I did not know that there were methods like GetEnergyLoss, But now i see they are defined in FairMcPoint. Thanks for that
Regarding the leaves, i did guess the meaning of some of them but what i did not understand is the numbering of the trackID, motherID etc...
And just so that we are on the same page, this is a simulation ( just 10 events as you said correctly) of tau colliding with p, and i am selecting only the events which have tau in them. (to look at the decay channel of tau compared to a standard jet event).
here is what i am talking about:
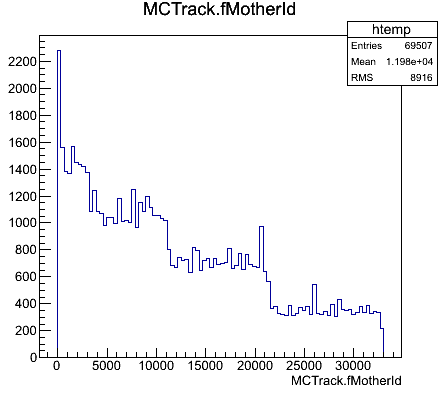

this last plot i should be pdgcode right, like 11 for electron, 22 for photon etc... ?
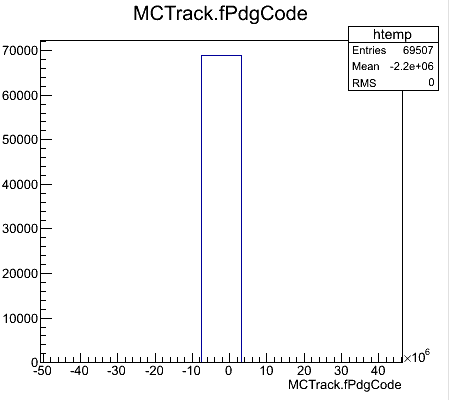
You yourself said that you are surprised with my trackID, so i want to know if there is documentation regarding tackid just like there is for particle id, if they are different that is.
Maybe Mohammad or Stefano can help us out here.
Regarding geotracks, they are just created during my simulation, i am not doing anything special to them, but can you tell me what they are used for?
Thanks again
Cheers
Raghav
|
|
|
|
| Re: New Update causing problems and Output Data analysis [message #13549 is a reply to message #13548] |
Wed, 30 May 2012 15:58   |
 StefanoSpataro
Messages: 2736
Registered: June 2005
Location: Torino
|
first-grade participant |

From: *to.infn.it
|
|
TrackId is present in the MCPoint and it is the index of the MCTrack object which has created the point. In this sense, if you have a calorimeter, you have a large number of secondaries producing signals, then the fTrackId will refer to each of this secondary particle. I think your output is normal.
MotherId is present in the MCTrack, and it is the index of the MCTrack which has created your MCTrack... I.e. a primary pion has trackId 0 and motherID -1 (it has no mother particle). If it decays into neutrino and muon, neutrino will have probably TrackId 1 and motherId 0 and muon will have TrackId 2 and motherId 0 (same mother id, 0, -> trackid of the primary pion, different trackid -> they are different particles).
PdgCode is the PDG particle code. You have to zoom around 0 to see if you fnd really particle, now your plot is dominated by particles with code 10^6 (ions or maybe cherenkov photons), and you are not able to see photons (22) or electrons (11).
|
|
|
|
| Re: New Update causing problems and Output Data analysis [message #13551 is a reply to message #13549] |
Wed, 30 May 2012 16:38  |
 Raghav Kunnawalkam
Messages: 63
Registered: February 2012
Location: Stony Brook, New York
|
continuous participant |
From: *physics.sunysb.edu
|
|
Hi Stefano
thanks for your response.
So if i understand correctly, the bigger the trackid number, the more secondary that particle is.
I also made my output more verbose including the trackid, motherid and the particle code during my simulation and now it makes more sense. I can follow it back to the first particle.
Cheers
Raghav
|
|
|
|
Goto Forum:
Current Time: Mon Dec 22 00:01:59 CET 2025
Total time taken to generate the page: 0.00778 seconds
|
 GSI Forum


